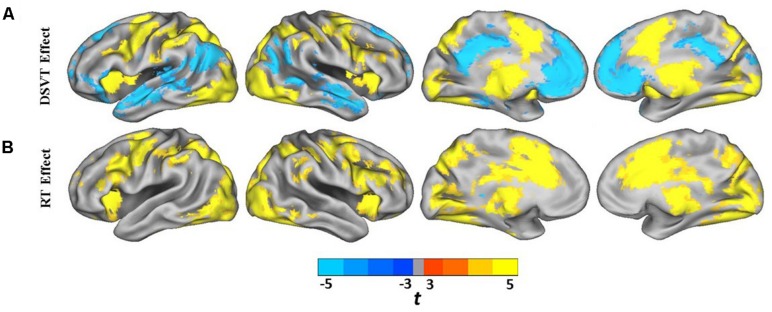
FIGURE 3.
Lateral and medial views of statistical parametric maps of DSVT effects and RT effects. (A) Color scaled t-values from voxel-wise one sample t-tests comparing mean percent DSVT-related BOLD percent signal change to zero. (B) Color scaled t-values from voxel-wise one sample t-tests comparing mean RT-related signal change to zero. All voxel-wise ps ≤ 0.005.

