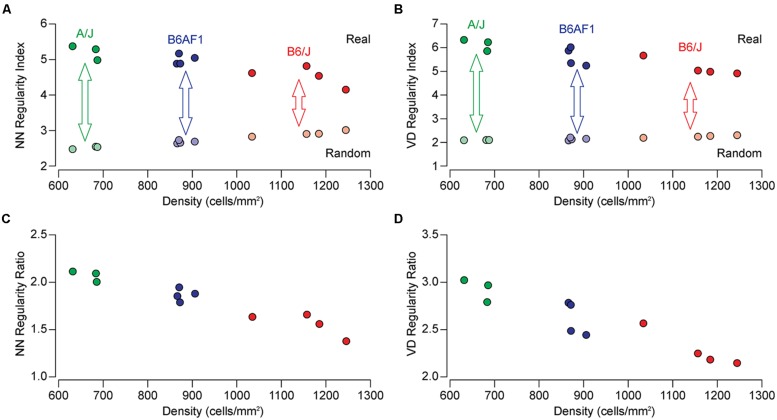
FIGURE 2.
(A,B) The NN and VD regularity indexes for individual mice of the A/J (green), B6AF1 (blue), and B6/J (red) strains as a function of cell density (indicated by the saturated colored symbols across the top). Each regularity index is the average of eight sampled fields per retina, while the density indicated is the average density for those eight fields. The regularity index for random simulations of the same average density (and constrained by soma size) are shown for comparison (indicated by the de-saturated colored symbols across the bottom). Notice the increase in regularity for the random distributions as a function of increasing density. (C,D) The NN and VD real/random regularity ratio (being the real regularity index divided by the random regularity index) for each retina presented in (A,B). A ratio of 1.0 would signify a mosaic that is no different from a random distribution matched in density and constrained by soma size. By normalizing the regularity index in this manner, the differences between the strains are enhanced.

