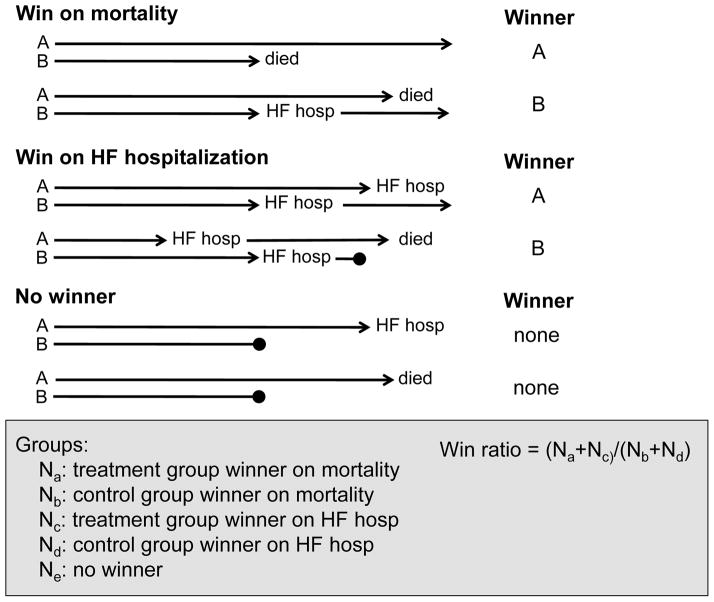
Figure 4. Schematic of the win ratio.
The win ratio is best performed using propensity matched patients pairs. For each pair a winner and loser is determined, or the pair is considered to be tied. The determination of a winner is made using a predefined hierarchical outcome scheme. In this example, mortality is considered the most important outcome followed by HF hospitalization. Possible scenarios resulting in a winner for mortality and HF hospitalization as well as no winner (or tied) are outlined. The length of each blue arrow indicates the duration of patient follow up. Arrows ending in a solid circle denote either incomplete or a shorter duration of follow up. The win ratio is calculated by adding the number of wins divided by the number of losses for the experimental group. A statistically significant win ratio that is greater than 1 indicates a positive outcome. (Modified from and reprinted with permission Pocock SJ, et al The win ratio: a new approach to the analysis of composite end points in clinical trials based on clinical priorities. Eur Heart J 2012; 33:176–82)

