Abstract
The gas phase thermochemical properties (tautomeric energies, acidity, and proton affinity) have been measured and calculated for adenine and six adenine analogs that were designed to test features of the catalytic mechanism used by the adenine glycosylase MutY. The gas phase intrinsic properties are correlated to possible excision mechanisms and MutY excision rates to gain insight into the the MutY mechanism. The data support a mechanism involving protonation at N7 and hydrogen bonding to N3 of adenine. We also explored the acid-catalyzed (non-enzymatic) depurination of these substrates, which appears to follow a different mechanism than that employed by MutY, which we elucidate using calculations.
Introduction
Cellular DNA is inevitably damaged by both exogenous and endogenous agents, resulting in a variety of chemical modifications that are associated with mutagenesis, carcinogenesis and aging.1-4 Oxidative damage is extremely prevalent, and one of the most common species formed by reactive oxygen species is 7,8-dihydro-8-oxo-guanine (OG).5-7 During DNA replication, adenine (A) is usually inserted opposite OG to form a relatively stable OG:A mismatch.8 Because undamaged guanine (G) prefers to pair with cytosine (C), not adenine, the oxidation, if not repaired, can result in permanent G:C →T:A transversion mutations.
In the face of the constant assault to DNA, organisms have developed elaborate DNA repair pathways. In Escherichia coli, oxidative damage is repaired by a “GO” repair pathway that utilizes three enzymes: MutT, Fpg, and MutY.9-11 MutT hydrolyzes the OG deoxynucleoside triphosphate to yield the OG deoxynucleoside monophosphate and pyrophosphate, preventing its incorporation into replicating DNA.12 Fpg (also called MutM) catalyzes removal of OG from OG:C base pairs, and an associated β and δ-lyase activity at the resultant abasic site leading to strand scission.1,13 MutY is a somewhat unusual glycosylase enzyme; rather than targeting a damaged base, MutY catalyzes removal of adenine from OG:A mispairs in DNA (Figure 1).1,12,13 MutY is remarkably specific such that 2’-deoxyadenosine residues within A:T pairs are not touched.
Figure 1.
Adenine removal from DNA catalyzed by the MutY glycosylase.
Because of the importance of damaged base repair to genome integrity, the mechanisms of repair enzymes are of great interest.11 MutY crystal structures, in particular a 2009 Bacillus stearothermophilus structure with a fluorinated 2’-deoxyadenosine, show multiple hydrogen bonding contacts as well as hydrophobic interactions between substrate and enzyme.14 Kinetic isotope effect studies imply an SN1-type reaction where the nucleobase leaves (possibly protonated at N7) to yield an oxacarbenium ion which is then attacked by water.14-16 Recent computational simulations support N7 protonation as well as an active site that organizes solvent to place water molecules into key catalytic positions.17
The examination of properties in the gas phase, which provides the “ultimate” nonpolar environment, reveals intrinsic reactivity that can be correlated to activity in other media, such as hydrophobic active sites.18-24 In this paper, we calculate and measure the gas phase acidities and proton affinities of a series of adenine analogs (not heretofore studied in vacuo) and compare these results to the relative rates of MutY-catalyzed base excision of these analogs within the context of duplex DNA paired with OG. The acid-catalyzed non-enzymatic cleavage of these substrates is also explored.
Results
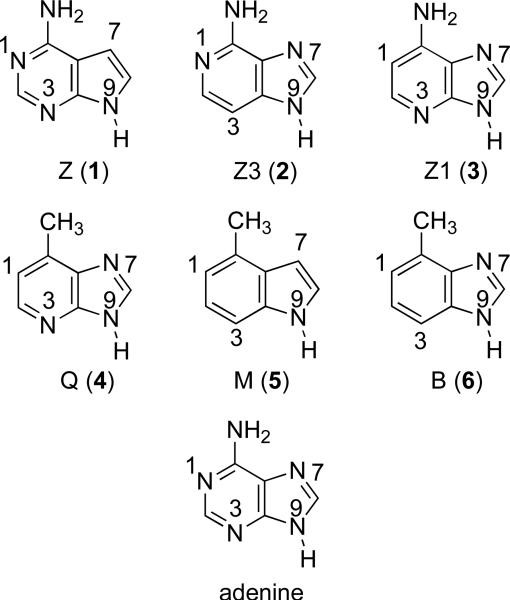
Adenine and the synthetically derived analogs studied herein are shown in Figure 2.25-27 7-Deazaadenine (Z), 3-deazaadenine (Z3) and 1-deazaadenine (Z1) are missing nitrogen at the N7, N3 and N1 positions, respectively (as compared to the parent adenine), and were designed to test the importance of the nitrogen at those positions.26-28 Substrates Q, M and B (with atoms numbered as for adenine, to be consistent) are nonpolar isosteres of adenine.25,27
Figure 2.
Adenine and synthetic analogs studied herein.
7-deazaadenine (Z, 1)
i. Calculations: Z tautomers, acidity, proton affinity
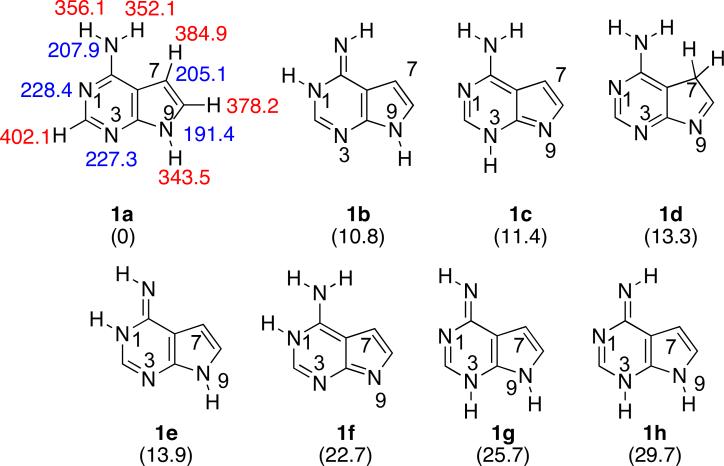
In our experience DFT methods generally yield accurate values for thermochemical properties of nucleobases, so we utilized B3LYP/6-31+G(d) to calculate the relative tautomeric stabilities, acidities (ΔHacid), and proton affinities (PA) of 7-deazaadenine (Z, 1).18,22,23,29,30 (Throughout the paper, acidity and basicity are calculated only for those tautomers within 10 kcal mol−1 of the most stable tautomer). Z has eight possible tautomeric structures (Figure 3). The most stable tautomer (1a) is over 10 kcal mol−1 more stable than the next most stable species. We also calculated the acidity and basicity of the most stable tautomer. The most acidic site of 1a is predicted to be the N9-H (ΔHacid = 343.5 kcal mol−1). The most basic site of tautomer 1a is the N1 (PA = 228.4 kcal mol−1).
Figure 3.
The eight possible tautomeric structures of 7-deazaadenine (Z). Gas phase acidities are in red; gas phase proton affinities are in blue. Relative stabilities are in parentheses. Calculations were conducted at B3LYP/6-31+G(d); reported values are ΔH at 298 K.
ii. Experiments: Z acidity
We measured the acidity of Z using acidity bracketing (details in the Experimental Section). The conjugate base of Z deprotonates butyric acid (ΔHacid = 346.8 ± 2.0 kcal mol−1); the reaction in the opposite direction (butyrate with Z) also occurs (Table 1). We therefore bracket the ΔHacid of Z as 347 ± 3 kcal mol−1.
Table 1.
Summary of results for acidity bracketing of Z (7-deazaadenine, 1).
iii. Experiments: Z proton affinity
In bracketing the PA of Z, we find that piperidine (PA = 228.0 ± 2.0 kcal mol−1) deprotonates protonated Z; the opposite reaction (Z deprotonating protonated piperidine) also occurs (Table 2). We therefore bracket the PA of Z to be 228 ± 3 kcal mol−1.
Table 2.
Summary of results for proton affinity bracketing of Z (7-deazaadenine, 1)
| Reference compound | PAa | Proton transferb | |
|---|---|---|---|
| Ref. base | Conj. acid | ||
| 1-methylpiperidine | 232.1 ± 2.0 | + | – |
| 1-methylpyrrolidine | 230.8 ± 2.0 | + | – |
| piperidine | 228.0 ± 2.0 | + | + |
| pyrrolidine | 226.6 ± 2.0 | – | + |
| 3-picoline | 225.5 ± 2.0 | – | + |
PAs are in kcal mol−1.31
A “+” indicates the occurrence and a “–” indicates the absence of proton transfer
3-deazaadenine (Z3, 2)
i. Calculations: Z3 tautomers, acidity, proton affinity
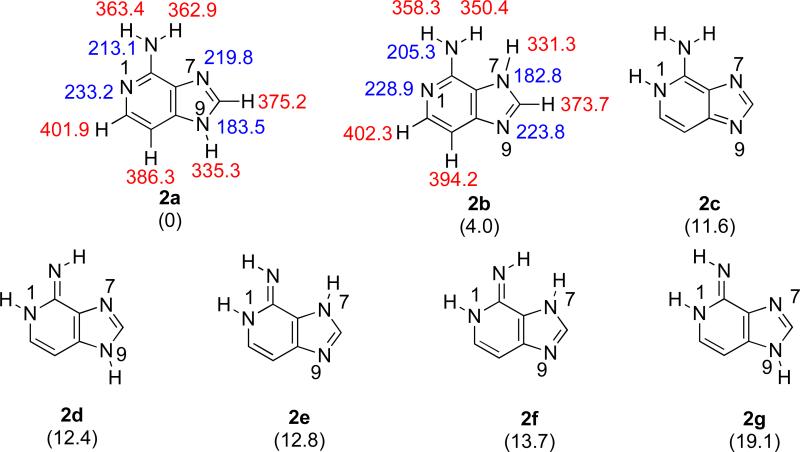
Z3 has seven possible tautomers, of which the most stable is the canonical “N9H” structure 2a (Figure 4). The “N7H” tautomer 2b is predicted to be 4 kcal mol−1 less stable than 2a. The gas phase acidity of 2a is 335.3 kcal mol−1 (corresponding to the N9-H). The most basic site of that tautomer is the N1, with a calculated PA of 233.2 kcal mol−1.
Figure 4.
The seven possible tautomeric structures of 3-deazaadenine (Z3). Gas phase acidities are in red; gas phase proton affinities are in blue. Relative stabilities are in parentheses. Calculations were conducted at B3LYP/6-31+G(d); reported values are ΔH at 298 K.
ii. Experiments: Z3 acidity
The acidity of Z3 was measured using the bracketing method (Table 3). We find that deprotonated Z3 is able to deprotonate 2-chloropropanoic acid (ΔHacid = 337.0 ± 2.1 kcal mol−1). The reaction in the opposite direction (2-chloropropanoate with Z3) also occurs; we therefore bracket the ΔHacid of Z3 to be 337 ± 3 kcal mol−1.
Table 3.
Summary of results for acidity bracketing of Z3 (3-deazaadenine, 2)
| Reference compound | ΔHacida | Proton transferb | |
|---|---|---|---|
| Ref. acid | Conj. base | ||
| methyl cyanoacetate | 340.80 ± 0.60 | – | + |
| trifluoro-m-cresol | 339.3 ± 2.1 | – | + |
| 2-chloropropanoic acid | 337.0 ± 2.1 | + | + |
| malononitrile | 335.8 ± 2.1 | + | – |
| pyruvic acid | 333.5 ± 2.9 | + | – |
| difluoroacetic acid | 331.0 ± 2.2 | + | – |
Acidities are in kcal mol−1.31
A “+” indicates the occurrence and a “–” indicates the absence of proton transfer.
iii. Experiments: Z3 proton affinity
The results for the bracketing of the PA of Z3 are in Table 4. We find that di-secbutylamine (PA = 234.4 ± 2.0 kcal mol−1) is able to deprotonate protonated Z3, but that the opposite reaction (protonated di-sec-butylamine with Z3) does not occur. 1-Methylpiperidine (PA = 224.7 ± 2.0 kcal mol−1) can not deprotonate protonated Z3, but Z3 can deprotonate protonated 1-methylpiperidine. We therefore bracket the PA of Z3 to be 233 ± 3 kcal mol−1.
Table 4.
Summary of results for proton affinity bracketing of Z3 (3-deazaadenine, 2)
| Reference compound | PAa | Proton transferb | |
|---|---|---|---|
| Ref. base | Conj. acid | ||
| 2,2,6,6-tetramethylpiperidine | 235.9 ± 2.0 | + | – |
| N,N-dimethylcyclohexylamine | 235.1 ± 2.0 | + | – |
| triethylamine | 234.7 ± 2.0 | + | – |
| di-sec-butylamine | 234.4 ± 2.0 | + | – |
| 1-methylpiperidine | 232.1 ± 2.0 | – | + |
| N,N-dimethylisopropylamine | 232.0 ± 2.0 | – | + |
| 1-methylpyrrolidine | 230.8 ± 2.0 | – | + |
| piperidine | 228.0 ± 2.0 | – | + |
PAs are in kcal mol−1.31
A “+” indicates the occurrence and a “–” indicates the absence of proton transfer
1-Deazaadenine (Z1, 3)
i. Calculations: Z1 tautomers, acidity, proton affinity
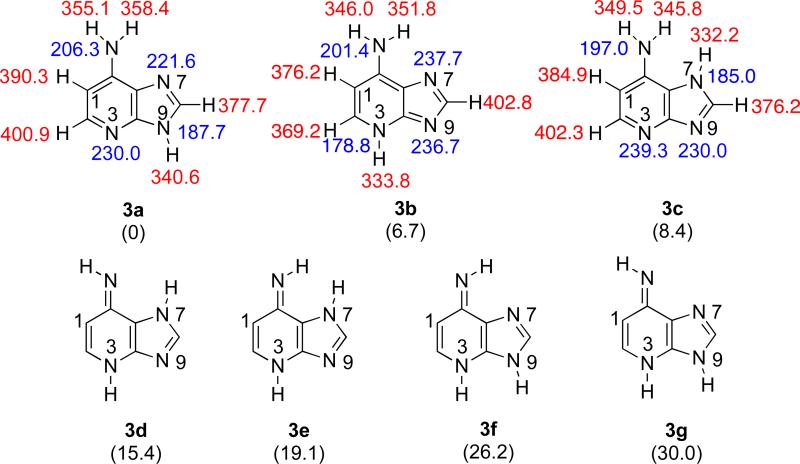
Z1 has seven possible tautomeric structures (Figure 5). The most stable tautomer (3a) is over 6 kcal mol−1 more stable than the next most stable species. The most acidic site of 3a is predicted to be the N9 proton (ΔHacid = 340.6 kcal mol−1). The most basic site of tautomer 3a is the N3 (PA = 230.0 kcal mol−1).
Figure 5.
The seven possible tautomeric structures of 1-deazaadenine (Z1). Gas phase acidities are in red; gas phase proton affinities are in blue. Relative stabilities are in parentheses. Calculations were conducted at B3LYP/6-31+G(d); reported values are ΔH at 298 K.
ii. Experiments Z1 acidity
Efforts to sublime Z1 into the gas phase for acidity and proton affinity bracketing were unsuccessful; we failed to see signal corresponding to the substrate. We were, however, able to measure the acidity and proton affinity using an alternate method to bracketing, the “Cooks kinetic method” (details on this method in the Experimental Section). For the acidity measurement, five reference acids were used: 2-fluorobenzoic acid (ΔHacid = 338.0 ± 2.2 kcal mol−1), 3-hydroxybenzoic acid (ΔHacid = 338.6 ± 2.1 kcal mol−1), benzoic acid (ΔHacid = 340.2 ± 2.2 kcal mol−1), phenylacetic acid (ΔHacid = 341.5 ± 2.1 kcal mol−1), and glycine (ΔHacid = 342.7 ± 2.2 kcal mol−1), yielding an acidity (ΔHacid) of 341 ± 3 kcal mol−1.
iii. Experiments: Z1 proton affinity
We were unable to measure Z1 PA by bracketing (vide supra), but were able to successfully utilize the Cooks kinetic method. Using guanine (PA = 229.3 ± 2.0 kcal mol−1), N-methylpyrrolidine (PA = 230.8 ± 2.0 kcal mol−1), 2,4-lutidine (PA = 230.1 ± 2.0 kcal mol−1), dimethylisopropylamine (PA = 232.0 ± 2.0 kcal mol−1), N-methylpiperidine (PA = 232.1 ± 2.0 kcal mol−1), and triethylamine (PA = 234.7 ± 2.0 kcal mol−1) as reference bases, we measure a PA for Z1 of 232 ± 3 kcal mol−1.
“6-methylated” 1-deazaadenine (Q, 4)
i. Calculations: Q tautomers, acidity, proton affinity
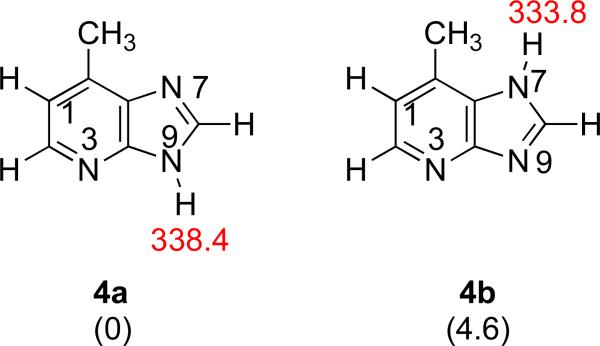
There are three possible tautomeric structures for Q (Figure 6). The most stable tautomer 4a is just over 4 kcal mol−1 more stable than the next most stable structure. The most acidic site of 4a is the N9-H, with a ΔHacid of 338.4 kcal mol−1. The most basic site is the N7, with a PA of 223.0 kcal mol−1.
Figure 6.
The three possible tautomeric structures of Q. Gas phase acidities are in red; gas phase proton affinities are in blue. Relative stabilities are in parentheses. Calculations were conducted at B3LYP/6-31+G(d); reported values are ΔH at 298 K.
ii. Experiments: Q acidity
The acidity of Q was bracketed as shown in Table 5. The reaction of deprotonated Q with methyl cyanoacetate (ΔHacid = 340.80 ± 0.60 kcal mol−1) occurs, as does the reverse reaction (deprotonated methyl cyanoacetate with Q). We therefore bracket the acidity of Q as 341 ± 2 kcal mol−1.
Table 5.
Summary of results for acidity bracketing of Q (4).
iii. Experiments: Q proton affinity
The proton affinity of Q was bracketed as shown in Table 6. The results are somewhat unusual, in that reaction was found to occur in both directions for reference bases with PAs between 1-methylpyrrolidine (230.8 ± 2.0 kcal mol−1) and pyridine (223.8. ± 2.0 kcal mol−1). The implications of this will be addressed in the Discussion.
Table 6.
Summary of results for proton affinity bracketing of Q (4).
| Reference compound | PAa | Proton transferb | |
|---|---|---|---|
| Ref. base | Conj. acid | ||
| 1-methylpiperidine | 232.1 ± 2.0 | + | – |
| 1-methylpyrrolidine | 230.8 ± 2.0 | + | – |
| piperidine | 228.0 ± 2.0 | + | + |
| pyrrolidine | 226.6 ± 2.0 | + | + |
| 4-picoline | 226.4 ± 2.0 | + | + |
| 3-picoline | 225.5 ± 2.0 | + | + |
| pyridine | 223.8 ± 2.0 | – | + |
| n-octylamine | 222.0 ± 2.0 | – | + |
PAs are in kcal mol−1.31
A “+” indicates the occurrence and a “–” indicates the absence of proton transfer
“6-methylated” 1,3,7-deazaadenine (M, 5)
i. Calculations: M tautomers, acidity, proton affinity
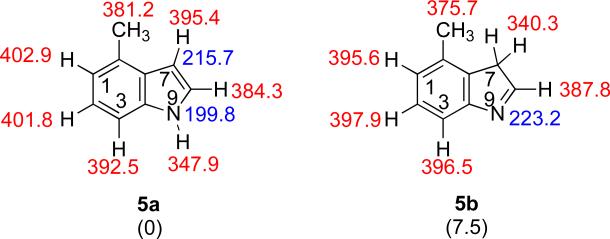
There are two possible tautomeric structures for M, with the more stable being so by over 7 kcal mol−1 (Figure 7). The more stable tautomer 5a has a calculated acidity (at the most acidic site, the N9-H) of 347.9 kcal mol−1. The PA of the most basic site, the C7, is 215.7 kcal mol−1.
Figure 7.
The two possible tautomeric structures of M. Gas phase acidities are in red; gas phase proton affinities are in blue. Relative stabilities are in parentheses. Calculations were conducted at B3LYP/6-31+G(d); reported values are ΔH at 298 K.
ii. Experiments: M acidity
Bracketing experiments with M were hindered by the inability to see any mass spectrometric signal when solid M is heated. However, we were able to vaporize (via electrospray) proton-bound dimers of M with reference acids, allowing us to measure the acidity of M via the Cooks kinetic method. Four reference acids were used (resorcinol (ΔHacid = 346.6 ± 2.1 kcal mol−1), propanoic acid (ΔHacid = 347.4 ± 2.2 kcal mol−1), imidazole (ΔHacid = 349.9 ± 0.7), and 3-aminophenol (ΔHacid = 350.5 ± 2.1 kcal mol−1)), yielding an acidity (ΔHacid) of 349 ± 3 kcal mol−1.
iii. Experiments: M proton affinity
As noted above, bracketing experiments with M were unsuccessful. In addition, measurement of the PA of M by the Cooks kinetic method also failed, as we were unable to form robust signal for proton-bound dimers with reference bases.
“6-methylated” 1,3-deazaadenine (B, 6)
i. Calculations: B tautomers, acidity, proton affinity
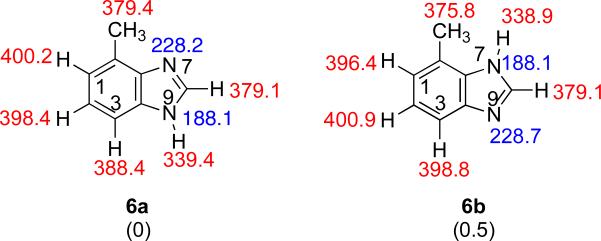
B has two possible tautomers, both of which are relatively close in stability (Figure 8). The most acidic site of the more stable tautomer 6a is the N9-H (ΔHacid = 339.4 kcal mol−1). The most basic site is the N7, with a calculated PA of 228.2 kcal mol−1.
Figure 8.
The two possible tautomeric structures of B. Gas phase acidities are in red; gas phase proton affinities are in blue. Relative stabilities are in parentheses. Calculations were conducted at B3LYP/6-31+G(d); reported values are ΔH at 298 K.
ii. Experiments: B acidity
The acidity of B was bracketed as shown in Table 7. The reaction of deprotonated B with methyl cyanoacetate (ΔHacid = 340.80 ± 0.60 kcal mol−1) occurs; however, deprotonated methyl cyanoacetate cannot deprotonate B. Deprotonated B cannot deprotonate 2,4-pentadione (ΔHacid = 343.8 ± 2.1 kcal mol−1), but deprotonated 2,4-pentadione does deprotonate B. We therefore bracket the acidity of B to be 343 ± 3 kcal mol−1.
Table 7.
Summary of results for acidity bracketing of B (6).
iii. Experiments: B proton affinity
The PA of B was measured using bracketing (Table 8). We find that the reaction with piperidine (PA = 228.0 ± 2.0 kcal mol−1) occurs in both directions (piperidine deprotonates protonated B, and B deprotonates protonated piperidine). We therefore measure the PA of B as 228 ± 3 kcal mol−1.
Table 8.
Summary of results for proton affinity bracketing of B (6).
| Reference compound | PAa | Proton transferb | |
|---|---|---|---|
| Ref. base | Conj. acid | ||
| 1-methylpiperidine | 232.1 ± 2.0 | + | – |
| 1-methylpyrrolidine | 230.8 ± 2.0 | + | – |
| piperidine | 228.0 ± 2.0 | + | + |
| pyrrolidine | 226.6 ± 2.0 | – | + |
| 3-picoline | 225.5 ± 2.0 | – | + |
PAs are in kcal mol−1.31
A “+” indicates the occurrence and a “–” indicates the absence of proton transfer
MutY-catalyzed base excision
Most of the unnatural adenine analogs studied herein (Z, Z3, Q, B, M) have previously been examined as substrates for MutY in DNA duplexes base-paired opposite OG, in order to probe enzymatic mechanistic features.25-28 However, the modified Z1 duplex substrate had not been previously examined and is not commercially available. The appropriate monomer for automated DNA synthesis was synthesized and incorporated into a 30-nucleotide strand (Supplementary Information). The glycosylase activity of MutY on a 30-bp duplex containing a central OG:X (X = adenine or adenine analog) was evaluated as previously reported.33 Briefly, this involves analyzing the extent of strand scission as a function of time after NaOH quenching of reaction mixtures. Reaction rate constants (kg) were measured under conditions of single-turnover ([MutY] > [DNA substrate]) to remove complications associated with rate-limiting product release. In the case of the OG:Z1-containing duplex, the measured rate constant at 37 °C is 0.3 ± 0.1 min−1. This represents a 40-fold decrease under the same conditions for the reaction of MutY with the corresponding OG:A-containing substrate (kg = 12 ± 2 min−1). For the series of adenine analog substrates, the MutY glycosylase activity (kg), relative to A, is shown in Table 9 (in decreasing order). The substrates are cleaved by MutY in the order: A>Q>Z1>Z3>B>>M=Z.
Table 9.
MutY excision of nucleobase analogs opposite OG within 30 bp DNA substrates.
| Nucleobase analog | kg (min−1)a | Fold reduced relative to OG:A substrate |
|---|---|---|
| A | 12 ± 2c | --- |
| Q (4) | 1.2 ± 0.2c | 10x |
| Z1 (3) | 0.31 ± 0.06 | 40x |
| Z3 (2) | 0.10 ± 0.05b | 100x |
| B (6) | < 0.002c | 6000x |
| M (5) | NCd,e | >24,000x |
| Z (1) | NCe | >24,000x |
Rates were measured at 37° C. Errors represent standard deviation from the average.
Value previously reported (reference26).
Value previously reported (reference25).
Not cleaved above detection limit (<0.0005 min−1).
Value previously reported (reference27).
fValue previously reported (reference28).
Acid-catalyzed depurination of A analog-containing DNA
Previous work has shown that comparing MutY rates to the susceptibility for acid-catalyzed depurination can reveal insight into features of the enzyme-catalyzed rate. Indeed, previous work with the hydrophobic analogues, B and Q, showed that these analogs are more susceptible to depurination than A.25 The relative acid-catalyzed depurination of Z1 and Z3 relative to A in the 30 nt oligonucleotide was evaluated using a modified Maxam Gilbert G+A reaction (Supplementary Information). The extent of depurination was quantitated using autoradiography (Figure S1, Supporting Information) and the relative extents of depurination of Z1, Z3 and A were normalized to depurination of another A (position 11) within the DNA sequence (Figure S2, Supporting Information). These results show that A, Z1, and Z3 at position 15 are depurinated at fractions of 0.9, 6.3, and 0.3 relative to A11 in the same DNA sequence. Interestingly, this shows that in contrast to the enzyme-catalyzed excision rates, in acidic water Z1 is depurinated seven times more than A whereas depurination of Z3 is three times less efficient (Table 10). The trend for acid-catalyzed depurination is: Q=Z1>B>A>Z3.
Table 10.
Relative cleavage of nucleobase analogs in acidic aqueous solution.
This work.
Reference25
Discussion
Calculated versus experimental values
The calculated acidity and proton affinity values for all the substrates studied herein are summarized in Table 11. (Adenine was previously measured and calculated by us and also appears in the Table). Generally, B3LYP/6-31+G(d) appears to provide fairly accurate predictions for the thermochemical values. The one instance where the calculated and experimental data are quite disparate is for the proton affinity of Q: the calculated value for the most stable tautomer is 223.0 kcal mol−1 yet the bracketing experiment yields a wide range where proton transfer occurs in both directions (PAs from 223.8 to 230.8 kcal mol1, Table 6). This is a fairly significant discrepancy.
Table 11.
Calculated (B3LYP/6-31+G(d); 298 K) and experimental data
| Substrate | Calculated value | Experimental valueb |
|---|---|---|
| Δ Hacida | ||
| Z (1) | 343.5 | 347 |
| Z3 (2) | 335.3 | 337 |
| Z1 (3) | 340.6 | (341) |
| Q (4) | 338.4 | 341 |
| M (5) | 347.9 | (349) |
| B (6) | 339.4 | 343 |
| adenine | 334.8c | 333 (335)c |
| PAa | ||
| Z (1) | 228.4 | 228 |
| Z3 (2) | 233.2 | 233 |
| Z1 (3) | 230.0 | (232) |
| Q (4) | 223.0 | 223.8-230.8 |
| M (5) | 215.7 | N/A |
| B (6) | 228.2 | 228 |
| adenine | 223.7c | 224 (225)c |
The wide range of proton transfer in both directions for the PA bracketing of Q (Table 6) raises the possibility that under our conditions, we have a mixture of the two most stable Q tautomers (4a and 4b), and the more basic 4b (calculated PA of 232.6 kcal mol−1) influences the experimentally observed value. Although the B3LYP/6-31+G(d) calculations indicate that 4b is nearly 5 kcal mol−1 less stable than 4a, prior studies show that accurate calculations of nucleobase tautomer stabilities can be elusive.35-39 It is possible that 4b is less stable than 4a but perhaps not by as much as the calculations indicate, such that there is some 4b present in our experiments.
For the PA bracketing experiment, the solid 4 is sublimed into the gas phase via a solids probe (typical pressure in the instrument is 10−7 to 10−8 Torr, and the probe is heated to a temperature of roughly 400K). If only 4a were present, one would expect a bracketed PA of around 223 kcal mol−1, based on the calculations (Figure 6, Table 11). The bracketing table would have a “crossover” point near pyridine (Table 12).
Table 12.
HYPOTHETICAL bracketing table if only 4a were present.
| Reference compound | PAa | Proton transferb | |
|---|---|---|---|
| Ref. base | Conj. acid | ||
| 1-methylpiperidine | 232.1 ± 2.0 | + | – |
| 1-methylpyrrolidine | 230.8 ± 2.0 | + | – |
| piperidine | 228.0 ± 2.0 | + | – |
| pyrrolidine | 226.6 ± 2.0 | + | – |
| 4-picoline | 226.4 ± 2.0 | + | – |
| 3-picoline | 225.5 ± 2.0 | + | – |
| pyridine | 223.8 ± 2.0 | – | + |
| n-octylamine | 222.0 ± 2.0 | – | + |
If only 4b were present, one would expect a similar table, except the “crossover point” would be near the PA of the most basic site of 4b, which is calculated to be 232.6 kcal mol−1 (Figure 6). Instead, as can be seen in Table 6, there is not a clean crossover point, but rather a range in which the deprotonation reaction occurs in both directions. We suspect that the reason for this is that both tautomers 4a and 4b are present.
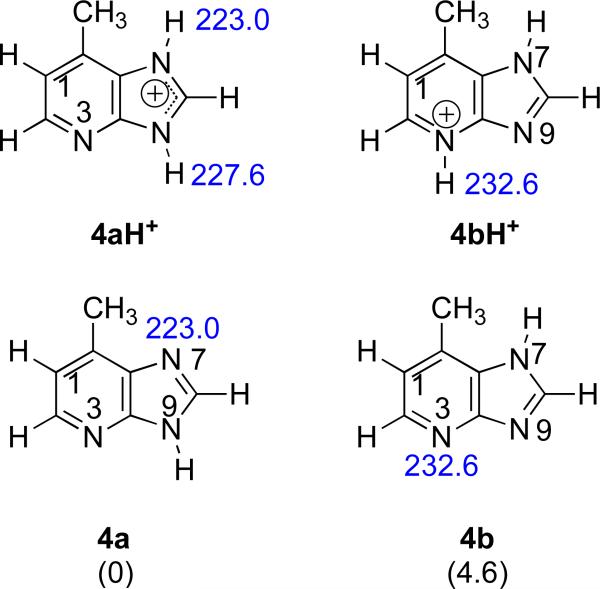
In the reactions of a reference base with protonated 4, if both tautomers were present, then the protonated substrate should be a mixture of 4aH+ and 4bH+ (Figure 9). Under these conditions, any reference base with a proton affinity greater than or equal to 223.0 kcal mol−1 should deprotonate 4a. Consistent with this expectation, we do observe proton transfer for all the reference bases from 3-picoline (PA = 225.5 kcal mol−1) to 1-methylpiperidine (PA = 232.1 kcal mol−1, Table 6, “Ref. base” column).
Figure 9.
Structures of 4a, 4b, 4aH+ and 4bH+ and calculated proton affinities. Relative stabilities of the two neutral tautomers are shown in parentheses. Calculations were conducted at B3LYP/6-31+G(d) [ΔH at 298 K in kcal mol−1].
In the opposite direction, the protonated reference bases are allowed to react with 4. If both 4a and 4b are present, we would expect reaction with any protonated reference base with a PA of about 232 kcal mol−1 or less, because 4b has a calculated PA of 232.6 kcal mol−1 (Figure 9). We actually see proton transfer “turn on” at a slightly lower value, 228.0 kcal mol−1 (at piperidine; Table 6, “Conj. acid” column). Still, this value is much higher than the calculated PA of 4a (223.0 kcal mol−1), pointing to the probable presence of 4b.
We suspect that the proton transfer “turning on” at a slightly lower value than calculated may be due to a mixture in which 4a predominates, with less of 4b. In this bracketing experiment, in order to ascertain whether proton transfer occurs, we measure the kinetics of the proton transfer. We track the disappearance of the protonated reference base signal under pseudo-first order conditions (excess of 4). We can measure the pressure of 4, but do not know what percentage is 4b versus 4a. Therefore, for those protonated reference bases that only react with 4b, we measure a rate constant for proton transfer that is less than the actual rate constant, because we can only measure the overall pressure of 4, but only 4b reacts. Our PA bracketing results are therefore consistent with a mixture of 4a and 4b, with 4a predominating.
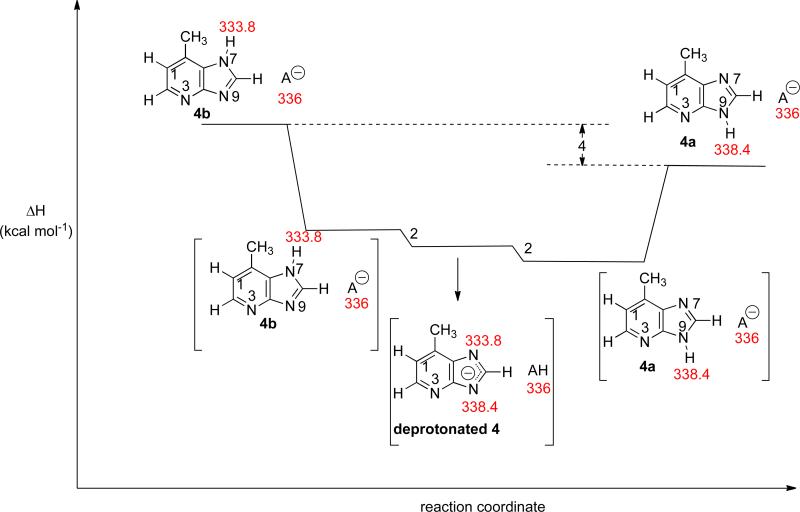
We should also address the bracketed acidity measurement of Q. Tautomer 4a has a calculated acidity of 338.4 kcal mol−1; tautomer 4b, 333.8 kcal mol−1. The measured value is 341 kcal mol−1, which implies the presence of tautomer 4a but not 4b. However, as we discuss above, we believe both tautomers are present. So why do we measure an acidity consistent with 4a only?
The deprotonation of both 4a and 4b results in the same anion, which is allowed to react with reference acids (Figure 10). This anion should be able to deprotonate any reference acid with ΔHacid of ~338 kcal mol−1 or less. Experimentally, we do see proton transfer “turn on” in this region, starting with methyl cyanoacetate (ΔHacid = 340.8 kcal mol−1, Table 5 (“Ref. acid” column)).
Figure 10.
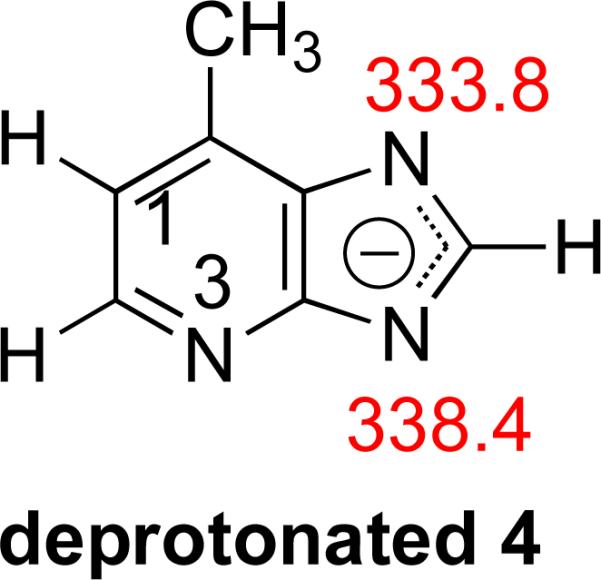
Structure of deprotonated 4a and 4b and calculated acidities. Calculations were conducted at B3LYP/6-31+G(d) [ΔH at 298 K in kcal mol−1].
In the opposite direction, deprotonated reference acids would be allowed to react with 4, which is presumably a mixture of 4a and 4b (Figure 11). In this direction, one would expect to see reaction with any deprotonated reference acid whose ΔHacid is 334 kcal mol−1 or higher (since 4b is present). Instead, however, we do not see proton transfer “turn on” until 340.8 kcal mol−1 (Table 5, “Conj. base” column). We believe that two factors are at play: one, as we saw with the PA experiments, we have less 4b present, so reactions with 4b will appear slower than they are. Second, we cannot preclude base-catalyzed tautomerization of 4b to 4a taking place during the bracketing experiment (Figure 12; brackets indicate ion-molecule complexes; A– is the deprotonated reference acid). In Figure 12, we show the reaction of a deprotonated reference acid A– with 4b. In this Figure, the reference acid has a ΔHacid of 336 kcal mol−1, which is a higher value than the ΔHacid of 4b, so proton transfer occurs to form deprotonated 4. However, if a subsequent proton transfer takes place (whereby the N9– of deprotonated 4, whose conjugate acid has an acidity of 338.4 kcal mol−1, deprotonates AH), then 4a and A– are formed as products (Figure 12). Proton transfer between 4b and A– has occurred, but since we only track the m/z ratio of A–, we would have no way of knowing that proton transfer occurred. The exothermic scenario shown in Figure 12 would look, by mass spectrometry, as if no proton transfer has taken place: one would only see A– signal when following the reaction progress. This would therefore be marked as a “–” in the last column of Table 5, even though proton transfer has occurred. Essentially, therefore, the “–” entries in the rightmost column of Table 5 may actually be incorrect. Thus, the bracketed ΔHacid value of 341 kcal mol−1 does not necessarily mean that 4b is not present.
Figure 11.
Structures of 4a and 4b and calculated acidity of the most acidic site. Relative stabilities of the two neutral tautomers are shown in parentheses. Calculations were conducted at B3LYP/6-31+G(d) [ΔH at 298 K in kcal mol−1].
Figure 12.
Reaction coordinate for the base-catalyzed tautomerization of 4b to 4a. “A–” represents deprotonated reference acid. Values in red are B3LYP/6-31+G(d) calculated ΔHacid values (298 K).
Given the wide range of proton transfer in both directions for the PA experiment (Figure 6) and the ambiguity associated with knowing whether proton transfer occurred in the acidity experiment, we therefore believe that we most likely have a mixture of 4a and 4b present under our experimental conditions, with 4a predominating.
Biological implications
MutY is a glycosylase that cleaves adenine when it is base-paired to OG. The unnatural substrates studied herein (Z, Z3, Z1, Q, B, M) were synthesized and examined as substrates for MutY, in order to probe enzymatic mechanistic features (most in prior work).25-28 The rates of excision, relative to A, are shown in Table 9 (in decreasing order). The substrates are cleaved by MutY in the order: A>Q>Z1>Z3>B>>M=Z.
As a key step in initiating DNA repair, BER glycosylases, such as MutY, cleave the N-glycosidic bond (Figure 1) to release the damaged or inappropriate base. MutY is a monofunctional glycosylase that hydrolyzes the N-glycosidic bond on 2’-deoxyadenosine to yield an abasic site-DNA product and free adenine base. We are interested in whether the intrinsic properties that we study herein can lend insight into the features used by MutY to catalyze N-glycosidic bond breakage. Presumably, the better a leaving group the nucleobase is, the more easily it is cleaved. Since acidity and leaving group ability are generally correlated, we would expect more easily cleaved bases to be more acidic. By examining the intrinsic N9-H bond stability for various possible mechanisms, we can lend insight into the operative mechanism. Furthermore, based on our studies with other glycosylases, we postulate that MutY may provide a nonpolar active site that serves to enhance the differences in acidity among nucleobases, and in doing so, aids in the discrimination of substrate bases over nonsubstrate bases.18,19,21,23,40 Thus, studies in the gas phase, which is the ultimate nonpolar environment, are relevant.
Mechanistic studies of MutY, including crystal structure, KIE studies, and computer (molecular dynamics and QM/MM) simulations point to protonation at N7 to facilitiate cleavage.14-17,41 A recent crystal structure of Bacillus stearothermophilus MutY bound to a DNA duplex containing a fluorinated 2’-deoxyadenosine paired with OG shows multiple hydrogen bonding contacts as well as hydrophobic interactions between substrate and enzyme.14,16,41 Glu-43 and Tyr-126 coordinately contact the N7; the position of the glutamate indicates that it is probably protonated (the carboxylic acid as opposed to the carboxylate). Glu43 is expected to be quite acidic, allowing partial or full bonding of its proton to N7. A hydrogen bond from Arg-26 to water to N3 is observed, as well as a hydrogen bond from Arg-31 to N1. Various salt bridges exclude water and create a hydrophobic environ.14,16,25-27
Acidity: N9-H acidity of neutral nucleobase analogs
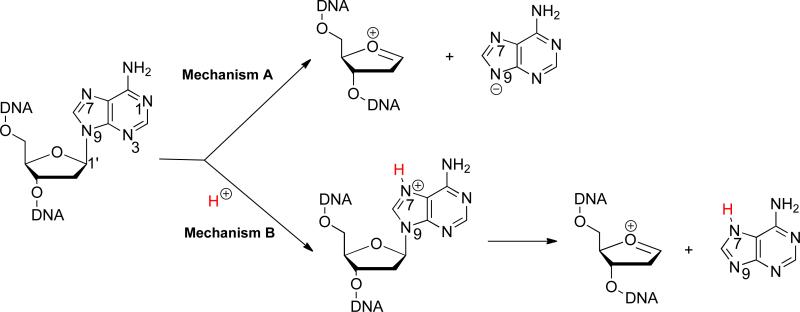
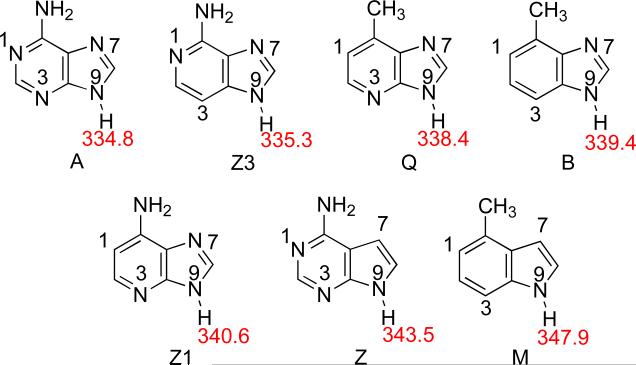
First we considered a mechanism where the N-glycosidic bond is simply cleaved without any pre-protonation; in such a scenario, the leaving group is a deprotonated anion (Mechanism A, Scheme 1). In this case, the acidities of the neutral substrates will correlate to their leaving group abilities. The calculated (B3LYP/6-31+G(d)) values for the N9-H acidity for the neutral nucleobase analogs are shown in Figure 13. Lower values are more acidic, so adenine is the most acidic substrate (ΔHacid of 334.8 kcal mol−1).21,22,39,42-47 The next most acidic substrate is Z3 (ΔHacid = 335.3 kcal mol−1). (Substrates are ordered in increasing acidity). The trend from most to least acidic in the gas phase is: adenine (A)>Z3>Q>B>Z1>Z>M (where A is most acidic). This trend does not agree with the known excision rates for these substrates by MutY (Table 9), which is A>Q>Z1>Z3>B>>M=Z. Furthermore, the acidity values for Z and M do not seem high enough (relative to the other nucleobases) to explain the experimentally observed lack of excision. Thus, a mechanism where the nucleobases are simply cleaved as anions seems unlikely, at least based on the intrinsic acidity of these substrates. This is not too surprising, since most experimental evidence points to pre-protonation at N7 (Mechanism B, Scheme 1).
Scheme 1.
Figure 13.
Calculated (B3LYP/6-31+G(d)) gas phase acidities (ΔH, kcal mol−1) of the N9-H for neutral adenine analogs. Substrates are ordered in decreasing acidity (increasing ΔHacid value).
Acidity: N9-H acidity of N7-protonated substrates
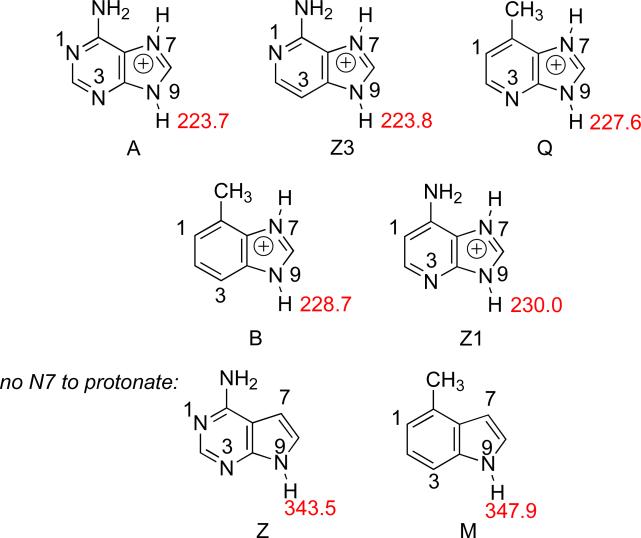
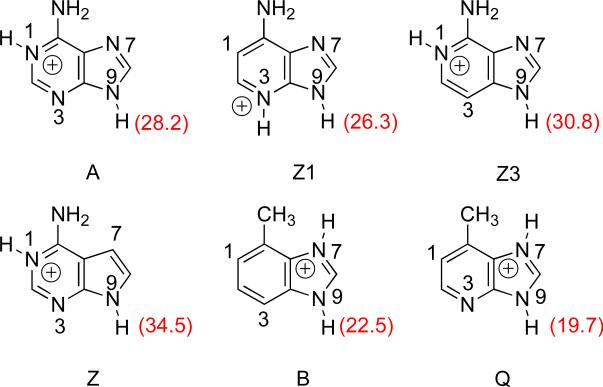
The N9-H acidity values for the N7-protonated nucleobase analogs are shown in Figure 14 (listed in order of increasing acidity). N7-Protonation greatly increases the N9-H acidity (by more than 100 kcal mol−1). The acidity trend is: A~Z3>Q>B>Z1>>Z>M. (The acidities of Z and M without protonation are shown since they lack an N7).
Figure 14.
Calculated (B3LYP/6-31+G(d)) gas phase acidities (kcal mol−1) of the N9-H for N7-protonated nucleobase analogs. (Z and M have no N7 to protonate; acidities are shown for comparison). Substrates are ordered in decreasing acidity (increasing ΔHacid values).
The acidity trend, at first glance, does not correlate to the known excision rates for these substrates by MutY (Table 9, A>Q>Z1>Z3>B>M=Z) . However, there are some consistencies. M and Z, because of the inability to protonate at N7, are the least acidic by far and would not expect to be prone to cleavage, which is what is observed experimentally. Q and Z1 are more easily cleaved than would be predicted by the acidities in Figure 14, but both have one feature in common: a nitrogen at N3, which has been proposed to be important for MutY excision.14,16,25,26
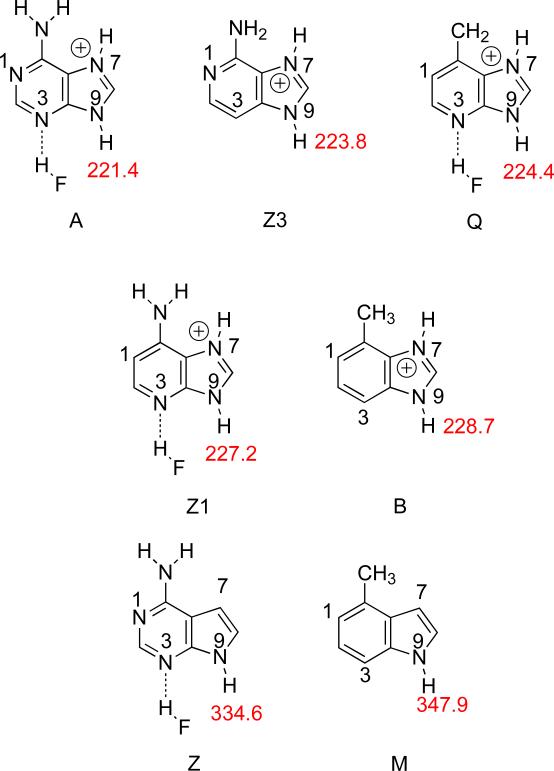
In order to model the effect of acidity by hydrogen bonding at N3, we used HF as a simple hydrogen bonding donor.48 The hydrogen bond at N3 increases the acidity at the N9-H of the N7-protonated substrates by roughly 2-3 kcal mol−1. In Figure 15, we show the gas phase acidities of the substrates protonated at N7 and hydrogen bonded to N3 (when the N is present at the 7 and 3 positions). The resultant acidity trend is: A>Z3~Q>Z1>B>>Z>M.
Figure 15.
Calculated (B3LYP/6-31+G(d)) gas phase acidities (kcal mol−1) of the N9-H for N7-protonated, N3-hydrogen-bonded adenine analogs. Substrates are ordered in decreasing acidity (increasing ΔHacid values).
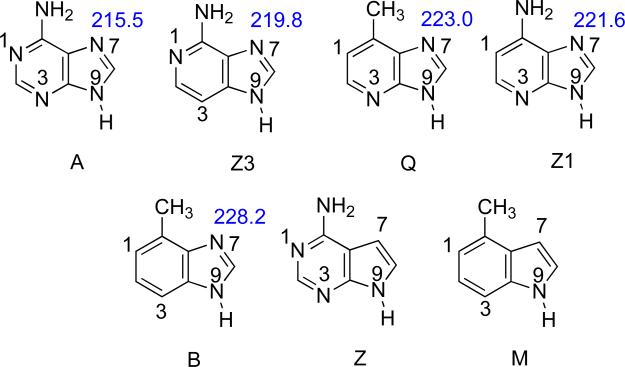
This trend compares quite favorably to the actual MutY excision rates (Table 9, A>Q>Z1>Z3>B>M=Z). The only substrate “out of place” is the Z3, whose gas phase acidity when protonated at N7 is quite high and implies that Z3 should be prone to cleavage. The reduced ability of MutY to remove Z3 is somewhat of a mystery from the experimental point of view as well; in earlier work one of us postulated that the lack of a N at the 3-position might render the N7 more difficult to protonate, which could reduce excision rate. Our gas phase PA calculations do indicate that Z3 is less basic at N7 than Q and Z1 (Figure 16), so this may explain the observed excision trend.25-28
Figure 16.
Calculated (B3LYP/6-31+G(d)) gas phase PAs (ΔH, kcal mol−1) of the N7 for adenine and analogs. Substrates are ordered in increasing PA.
Thus, the gas-phase N9-H acidities of these substrates can be compared to known excision rates to lend insight into the MutY mechanism. The gas-phase acidities of the substrates track with excision rates when the N7 is protonated and a hydrogen bond is formed to the N3, implying that these are features that MutY may provide to enable nucleobase cleavage.
Acid-catalyzed non-enzymatic depurination
We have also studied the nonenzymatic excision of some of these nucleobase analogs in acidic aqueous solution and find a different trend than that for MutY-catalyzed excision. B, Q and Z1 are depurinated more quickly than A while Z3 is depurinated more slowly (Q=Z1>B>A>Z3, Table 10).25 Because this excision trend is different from that catalyzed by MutY, we postulate that the mechanism in acidic aqueous solution is different. Presumably, under acidic conditions, the most basic site of a given nucleobase analog is protonated, which favors cleavage of the nucleobase. Since the most basic site is not always N7, the acidic aqueous mechanism is different from that of MutY.
To mimic these conditions, relevant calculations should involve pre-protonation of the most basic site and a polar environment. To that end, we calculated the N9-H acidity for the nucleobase analogs when the most basic site is protonated, in a water dielectric (Figure 17). The acidity values are much lower than those in the gas phase, as would be expected in water. These calculations indicate an N9-H acidity trend of: Q>B>Z1>A>Z3. We would therefore expect Q, B and Z1 to be cleaved more quickly than adenine, and Z3 to be cleaved more slowly, which is consistent with the experimental results (Table 10). The calculations, which do not include specific solvation, are not perfect; B is predicted to be more quickly cleaved than Z1 but experimentally the opposite is observed. However, the overall trend of which bases should be cleaved more quickly than A and which less quickly is consistent between calculations and experiment, supporting a mechanism in which acid pre-protonates the most basic site prior to cleavage.
Figure 17.
Aqueous N9-H acidities (kcal mol−1) of nucleobase analogs with the most basic site protonated.
1,3-deazaadenine (Z13) prediction
One additional substrate we studied computationally is Z13 (Figure 18). This is a logical extension of the various analogs already studied (Figure 2); this particular derivative is missing an “N” at both the 1 and 3 positions. Z13 could be a substrate for MutY, although the only nitrogen available for hydrogen bonding and/or protonation is the N7. Compared to the other nucleobase analogs, the acidity at N9-H when that N7 is protonated is fairly poor (ΔHacid = 230.1 kcal mol−1). Given our hypothesis that the N7 is protonated and the N3 is hydrogen bonded, the acidity of the N9-H of Z13 is even less than that of B (Figure 15). We would therefore expect Z13 to be cleaved by MutY quite slowly, even more slowly than B (but still faster than Z or M) .
Figure 18.
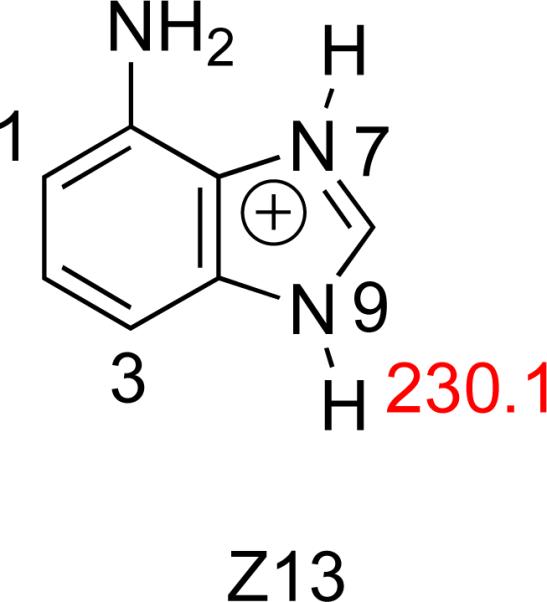
Calculated (B3LYP/6-31+G(d)) gas phase acidities (ΔH, kcal mol−1) of the N9-H for N7-protonated nucleobase analog Z13.
Conclusions
The heretofore unknown thermochemical properties of adenine and six adenine analogs have been calculated and measured herein. Gas phase measurements benchmark our calculations. Comparison of the stability of the N9-H bond (in terms of acidity) versus known MutY excision rates point to a MutY-catalyzed mechanism involving protonation at N7, with hydrogen bonding at N3. This conclusion is consistent with other MutY mechanistic studies (crystal structures, kinetic isotope effects). We also find that our calculations for the N9-H acidity when the most basic site is protonated are consistent with experimental data for acid-catalyzed depurination in water. Our work shows that fundamental studies of biological species are valuable for lending insight into mechanisms for which these species are substrates.
Experimental
All of the nucleobase analogs (except Z1) and reference acids and bases are commercially available and were used as received. Synthesis of 1-deazaadenosine (Z1) and Z1-containing oligonucleotides was similar to methods previously described; additional details are in the Supporting Information.49 Adenine glycosylase assays and acid-catalyzed depurination reactions were also performed as described previously; additional details are provided in the Supporting Information.25
The bracketing method was used to measure the gas phase acidity and proton affinity values. A Fourier transform ion cyclotron resonance mass spectrometer (FT-ICR) with dual cell setup (described previously) was used.18,19,21,34,50 The magnetic field is 3.3 T; the baseline pressure is 1 × 10⁻⁹ Torr. The solid nucleobase analogs were introduced into the cell via a heatable solids probe, while liquid reference acids and bases were introduced via a system of heatable batch inlets. Water was pulsed into the cell, and ionized by an electron beam (typically 8 eV (for HO–), 20 eV (for H3O+), 6 μA, 0.5 s) to generate hydroxide and hydronium ions. Substrate ions were generated by deprotonation or protonation of reference acids or bases (with hydroxide or hydronium ions, respectively), then selected, and transferred from one cubic cell to another via a 2-mm hole in the middle trapping plate. Transferred ions were cooled with pulsed argon gas that allowed the pressure to rise to 10−5 Torr. Experiments were conducted at ambient temperature.
The typical protocol for bracketing experiments has been described previously.18,19,29,30,50 Proton transfer reactions were conducted in both directions. For example, for Z3 acidity bracketing, hydroxide is used to deprotonate neutral Z3. Deprotonated Z3 is transferred into the adjoining cell where it is allowed to react with the neutral reference acid AH with known gas phase acidity. In the opposite direction, the deprotonated reference acid A– is generated and transferred into the adjoining cell where it is allowed to react with neutral Z3. The occurrence of proton transfer is regarded as evidence that the reaction is exothermic (denoted as “+” in the tables). Bracketing experiments are run under pseudo-first-order conditions with the neutral reactant in excess, relative to the reactant ions. Reading the pressure of the neutral compounds from the ion gauges is not always accurate; therefore, we “back out” the neutral substrate pressure from fast control reactions (described previously).19,22,23,30,51,52
We also utilized the Cooks kinetic method in a quadrupole ion trap (LCQ) mass spectrometer53-56 to measure the acidities and proton affinities of adenine analogs. The Cooks kinetic method involves the formation of a proton-bound complex, or dimer, of the unknown and a reference acid or base of known acidity or PA.
The proton-bound dimer ions are generated by electrospray (ESI) of 250 μM solutions of an unknown and a reference acid (or base, for PA measurement). Water–methanol (20%) solution is used as solvent.57 One drop of acetic acid (for PA measurements) or ammonium hydroxide (for acidity measurements) is occasionally used to promote dimer formation. An electrospray needle voltage of ~4 kV and a flow rate of 25 μL/min is applied. The proton-bound complex ions are isolated and then dissociated by applying collision-induced dissociation (CID); the complexes are activated for about 30 ms. Finally, the dissociation product ions are detected to give the ratio of the deprotonated (or protonated) analyte and deprotonated (or protonated) reference acid. A total of 40 scans are averaged for the product ions.
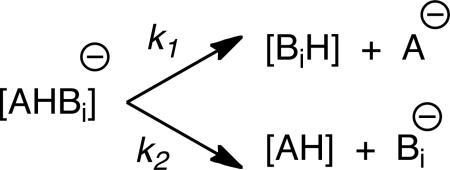
The dissociation of the proton bound dimer [AHBi]− is depicted in Eq. 1 (where AH is the compound of unknown acidity and BiH represents a series of reference acids of known acidity). The rate constants k1 and k2 are for the two different dissociation pathways.
 |
(Eq. 1) |
| (Eq. 2) |
The relationship of these rate constants to ΔHacid is shown in Eq. 2, where R is the gas constant and Teff is the effective temperature58 of the activated dimer.53-56 The ratio of the intensities of the two deprotonated products yields the relative acidity of the two compounds of interest (Eq. 2), assuming the dissociation has no reverse activation energy barrier and that the dissociation transition structure is late (and therefore indicative of the stability of the two deprotonated products). These assumptions are generally true for proton bound systems.56,59,60
In order to obtain the acidity of compound AH, the natural logarithm of the relative intensity ratios is plotted versus the acidities for a series of reference acids (BiH), where the slope is (1/RTeff) and the y-intercept is (-ΔHAH/RTeff). The Teff is obtained from the slope. The acidity of compound AH, (ΔHAH) is calculated from either Eq. 2 or the y-intercept. The same procedure was applied for proton affinity measurements (via formation of positively charged proton bound dimers).
The gas phase calculations were conducted at the B3LYP/6-31+G(d) level using Gaussian03 and Gaussian09.61-65 All the structures were fully optimized in the gas phase, and frequencies calculated (no imaginary frequencies were found). Acidity and proton affinity values are reported as ΔH at 298 K.
Dielectric medium calculations were done using the conductor-like polarizable continuum solvent model (CPCM, single point calculations on B3LYP/6-31+G(d) gas phase optimized structures; UAKS cavity) at B3LYP/6-31+G(d) as implemented in Gaussian03.66,67,68 The “total free energy in solution” values are reported, and the solvation free energy of a proton (-264.0 kcal mol−1) is accounted for.69,70
Supplementary Material
ACKNOWLEDGMENTS
We gratefully thank the NSF, ACS-PRF, NCI/NIH (CA67985) and the National Center for Supercomputer Applications for support.
Footnotes
SUPPORTING INFORMATION AVAILABLE
Cartesian coordinates for all calculated species, experimental details, acid-catalyzed depurination assays (Figure S1, S2) and full citations for references with greater than 16 authors are available. This material is available free of charge via the Internet at http://pubs.acs.org.
REFERENCES
- 1.David SS, Williams SD. Chem. Rev. 1998;98:1221–1261. doi: 10.1021/cr980321h. [DOI] [PubMed] [Google Scholar]
- 2.Lindahl T. Nature. 1993;362:709–715. doi: 10.1038/362709a0. [DOI] [PubMed] [Google Scholar]
- 3.Klaunig JE, Kamendulis LM. Annu. Rev. Pharmacol. Toxicol. 2004;44:239–267. doi: 10.1146/annurev.pharmtox.44.101802.121851. [DOI] [PubMed] [Google Scholar]
- 4.Neeley WL, Essigmann JM. Chem. Res. Toxicol. 2006;19:491–505. doi: 10.1021/tx0600043. [DOI] [PubMed] [Google Scholar]
- 5.Shigenaga MK, Park J-W, Cundy KC, Gimeno CJ, Ames BN. Methods Enzymol. 1990;186:521–530. doi: 10.1016/0076-6879(90)86146-m. [DOI] [PubMed] [Google Scholar]
- 6.Dizdaroglu M. Biochemistry. 1985;24:4476–4481. doi: 10.1021/bi00337a032. [DOI] [PubMed] [Google Scholar]
- 7.Burrows CJ, Muller JG. Chem. Rev. 1998;98:1109–1152. doi: 10.1021/cr960421s. [DOI] [PubMed] [Google Scholar]
- 8.McAuley-Hecht KE, Leonard GA, Gibson NJ, Thomson JB, Watson WP, Hunter WN, Brown T. Biochemistry. 1994;33:10266–10270. doi: 10.1021/bi00200a006. [DOI] [PubMed] [Google Scholar]
- 9.Cunningham RP. Mutat. Res. 1997;383:189–196. doi: 10.1016/s0921-8777(97)00008-6. [DOI] [PubMed] [Google Scholar]
- 10.Michaels ML, Tchou J, Grollman AP, Miller JH. Biochemistry. 1992;31:10964–10968. doi: 10.1021/bi00160a004. [DOI] [PubMed] [Google Scholar]
- 11.David SS, O'Shea VL, Kundu S. Nature. 2007;447:941–950. doi: 10.1038/nature05978. [DOI] [PMC free article] [PubMed] [Google Scholar]
- 12.Michaels ML, Miller JH. J. Bacteriol. 1992;174:6321–6325. doi: 10.1128/jb.174.20.6321-6325.1992. [DOI] [PMC free article] [PubMed] [Google Scholar]
- 13.Michaels ML, Cruz C, Grollman AP, Miller JH. Proc. Natl. Acad. Sci. 1992;89:7022–7025. doi: 10.1073/pnas.89.15.7022. [DOI] [PMC free article] [PubMed] [Google Scholar]
- 14.Lee S, Verdine GL. Proc. Natl. Acad. Sci. 2009;106:18497–18502. doi: 10.1073/pnas.0902908106. [DOI] [PMC free article] [PubMed] [Google Scholar]
- 15.McCann JAB, Berti PJ. J. Am. Chem. Soc. 2008;130:5789–5797. doi: 10.1021/ja711363s. [DOI] [PubMed] [Google Scholar]
- 16.Fromme JC, Banerjee A, Huang SJ, Verdine GL. Nature. 2004;427:652–656. doi: 10.1038/nature02306. [DOI] [PubMed] [Google Scholar]
- 17.Brunk E, Arey JS, Rothlisberger U. J. Am. Chem. Soc. 2012;134:8608–8616. doi: 10.1021/ja301714j. [DOI] [PubMed] [Google Scholar]
- 18.Kurinovich MA, Lee JK. J. Am. Chem. Soc. 2000;122:6258–6262. [Google Scholar]
- 19.Liu M, Xu M, Lee JK. J. Org. Chem. 2008;73:5907–5914. doi: 10.1021/jo800891c. [DOI] [PubMed] [Google Scholar]
- 20.Sun X, Lee JK. J. Org. Chem. 2010;75:1848–1854. doi: 10.1021/jo9023683. [DOI] [PubMed] [Google Scholar]
- 21.Sharma S, Lee JK. J. Org. Chem. 2002;67:8360–8365. doi: 10.1021/jo0204303. [DOI] [PubMed] [Google Scholar]
- 22.Zhachkina A, Liu M, Sun X, Amegayibor S, Lee JK. J. Org. Chem. 2009;74:7429–7440. doi: 10.1021/jo901479m. [DOI] [PubMed] [Google Scholar]
- 23.Sun X, Lee JK. J. Org. Chem. 2007;72:6548–6555. doi: 10.1021/jo070996x. [DOI] [PubMed] [Google Scholar]
- 24.Lee JK. Int. J. Mass Spectrom. 2005;240:261–272. [Google Scholar]
- 25.Francis AW, Helquist SA, Kool ET, David SS. J. Am. Chem. Soc. 2003;125:16235–16242. doi: 10.1021/ja0374426. [DOI] [PubMed] [Google Scholar]
- 26.Livingston AL, O'Shea VL, Kim T, Kool ET, David SS. Nature Chem. Biol. 2008;4:51–58. doi: 10.1038/nchembio.2007.40. [DOI] [PMC free article] [PubMed] [Google Scholar]
- 27.Chepanoske CL, Langelier CR, Chmiel NH, David SS. Org. Lett. 2000;2:1341–1344. doi: 10.1021/ol005831o. [DOI] [PubMed] [Google Scholar]
- 28.Porello SL, Williams SD, Kuhn H, Michaels ML, David SS. J. Am. Chem. Soc. 1996;118:10684–10692. [Google Scholar]
- 29.Kurinovich MA, Lee JK. J. Am. Soc. Mass Spectrom. 2002;13:985–995. doi: 10.1016/S1044-0305(02)00410-5. [DOI] [PubMed] [Google Scholar]
- 30.Liu M, Li T, Amegayibor S, Cardoso DS, Fu Y, Lee JK. J. Org. Chem. 2008;73:9283–9291. doi: 10.1021/jo801822s. [DOI] [PubMed] [Google Scholar]
- 31.Linstrom PJ, Mallard WG, editors. NIST Chemistry WebBook, NIST Standard Reference Database Number 69; retrieved in 2011. National Institute of Standards and Technology; Gaithersburg, MD: 20899, http://webbook.nist.gov. [Google Scholar]
- 32.Eyet N, Villano SM, Bierbaum VM. Int. J. Mass Spectrom. 2009;283:26–29. [Google Scholar]
- 33.Porello SL, Leyes AE, David SS. Biochemistry. 1998;37:14756–14764. doi: 10.1021/bi981594+. [DOI] [PubMed] [Google Scholar]
- 34.Sharma S, Lee JK. J. Org. Chem. 2004;69:7018–7025. doi: 10.1021/jo0303362. [DOI] [PubMed] [Google Scholar]
- 35.Wolken JK, Yao C, Turecek F, Polce MJ, Wesdemiotis C. Int. J. of Mass Spectrom. 2007;267:30–42. [Google Scholar]
- 36.Shukla MK, Leszczynski J. Chem. Phys. Lett. 2006;429:261–265. [Google Scholar]
- 37.Plekan O, Feyer V, Richter R, Coreno M, Vall-llosera G, Prince KC, Trofimov AB, Zaytseva IL, Moskovskaya TE, Gromov EV, Schirmer J. J. Phys. Chem. A. 2009;113:9376–9385. doi: 10.1021/jp903209t. [DOI] [PubMed] [Google Scholar]
- 38.Trygubenko SA, Bogdan TV, Rueda M, Orozco M, Luque FJ, Sponer J, Slavicek P, Hobza P. Phys. Chem. Chem. Phys. 2002;4:4192–4203. [Google Scholar]
- 39.Colominas C, Luque FJ, Orozco M. J. Am. Chem. Soc. 1996;118:6811–6821. and references therein. [Google Scholar]
- 40.Bennett MT, Rodgers MT, Hebert AS, Ruslander LE, Eisele L, Drohat AC. J. Am. Chem. Soc. 2006;128:12510–12519. doi: 10.1021/ja0634829. [DOI] [PMC free article] [PubMed] [Google Scholar]
- 41.Guan Y, Manuel RC, Arvai AS, Parikh SS, Mol CD, Miller JH, Lloyd RS, Tainer JA. Nat. Str. Biol. 1998;5:1058–1064. doi: 10.1038/4168. [DOI] [PubMed] [Google Scholar]
- 42.Podolyan Y, Gorb L, Leszczynski J. J. Phys. Chem. A. 2000;104:7346–7352. and references therein. [Google Scholar]
- 43.Hanus M, Kabelac M, Rejnek J, Ryjacek F, Hobza P. J. Phys. Chem. B. 2004;208:2087–2097. doi: 10.1039/b501499a. [DOI] [PubMed] [Google Scholar]
- 44.Russo N, Toscano M, Grand A, Jolibois F. J. Comput. Chem. 1998;19:989–1000. [Google Scholar]
- 45.Huang Y, Kenttämaa H. J. Phys. Chem. A. 2004;108:4485–4490. [Google Scholar]
- 46.Chandra AK, Nguyen MT, Uchimaru T, Zeegers-Huyskens T. J. Phys. Chem. A. 1999;103:8853–8860. [Google Scholar]
- 47.Del Bene JE. J. Phys. Chem. 1983;87:367–371. [Google Scholar]
- 48.We also attempted to use water as the hydrogen bond donor, but calculations were complicated by the propensity of the water proton to hydrogen bond to N9 after deprotonation.
- 49.DeCarlo L, Prakasha Gowda AS, Suo Z, Spratt TE. Biochemistry. 2008;47:8157–8164. doi: 10.1021/bi800820m. [DOI] [PMC free article] [PubMed] [Google Scholar]
- 50.Kurinovich MA, Lee JK. Chem. Commun. 2002:2354–2355. doi: 10.1039/b207112f. [DOI] [PubMed] [Google Scholar]
- 51.Chesnavich WJ, Su T, Bowers MT. J. Chem. Phys. 1980;72:2641–2655. [Google Scholar]
- 52.Su T, Chesnavich WJ. J. Chem. Phys. 1982;76:5183–5185. [Google Scholar]
- 53.Cooks RG, Kruger TL. J. Am. Chem. Soc. 1977;99:1279–1281. [Google Scholar]
- 54.McLuckey SA, Cameron D, Cooks RG. J. Am. Chem. Soc. 1981;103:1313–1317. [Google Scholar]
- 55.McLuckey SA, Cooks RG, Fulford JE. Int. J. Mass Spectrom. and Ion Physics. 1983;52:165–174. [Google Scholar]
- 56.Green-Church KB, Limbach PA. J. Am. Soc. Mass Spectrom. 2000;11:24–32. doi: 10.1016/S1044-0305(99)00116-6. [DOI] [PubMed] [Google Scholar]
- 57.Fenn JB, Mann M, Meng CK, Wong SF, Whitehouse CM. Science. 1989;246:64–71. doi: 10.1126/science.2675315. [DOI] [PubMed] [Google Scholar]
- 58.Drahos L, Vékey K. J. Mass Spectrom. 1999;34:79–84. doi: 10.1002/(SICI)1096-9888(199912)34:12<1373::AID-JMS907>3.0.CO;2-#. [DOI] [PubMed] [Google Scholar]
- 59.Ervin KM. Chem. Rev. 2001;101:391–444. doi: 10.1021/cr990081l. [DOI] [PubMed] [Google Scholar]
- 60.Gronert S, Feng WY, Chew F, Wu W. Int. J. Mass Spectrom. 2000;195/196:251–258. [Google Scholar]
- 61.Becke AD. J. Chem. Phys. 1993;98:5648–5652. [Google Scholar]
- 62.Lee C, Yang W, Parr RG. Phys. Rev. B. 1988;37:785–789. doi: 10.1103/physrevb.37.785. [DOI] [PubMed] [Google Scholar]
- 63.Kohn W, Becke AD, Parr RG. J. Chem. Phys. 1996;100:12974–12980. [Google Scholar]
- 64.Frisch MJ, et al. Gaussian 03. Gaussian, Inc.; Wallingford CT: 2004. [Google Scholar]
- 65.Frisch MJ, et al. Gaussian 09. Gaussian, Inc.; Wallingford CT: 2009. [Google Scholar]
- 66.Barone V, Cossi M. J. Phys. Chem. A. 1998;102:1995–2001. [Google Scholar]
- 67.Cossi M, Rega N, Scalmani G, Barone V. J. Comp. Chem. 2003;24:669–681. doi: 10.1002/jcc.10189. [DOI] [PubMed] [Google Scholar]
- 68.Takano Y, Houk KN. J. Chem. Theory Comput. 2005;1:70–77. doi: 10.1021/ct049977a. [DOI] [PubMed] [Google Scholar]
- 69.Tissandier MD, Cowen KA, Feng WY, Gundlach E, Cohen MH, Earhart AD, Coe JV, Tuttle TR. J. Phys. Chem. A. 1998;102:7787–7794. [Google Scholar]
- 70.Chipman DM. J. Phys. Chem. A. 2002;106:7413–7422. [Google Scholar]
Associated Data
This section collects any data citations, data availability statements, or supplementary materials included in this article.


