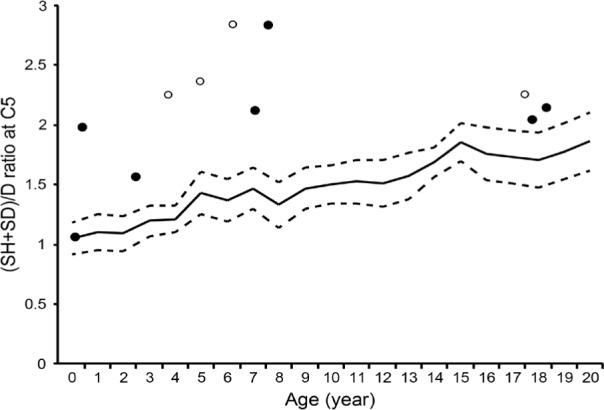
Figure 6.

Scatter plots showing the bone length ratio of the C5 spinous process height (SH) + depth (SD) to the C5 vertebral depth (D). Solid and open circles indicate male and female, respectively. Solid and dashed lines denote the normal value and the standard deviation (SD) of the (SH+SD)/D ratio, respectively.
