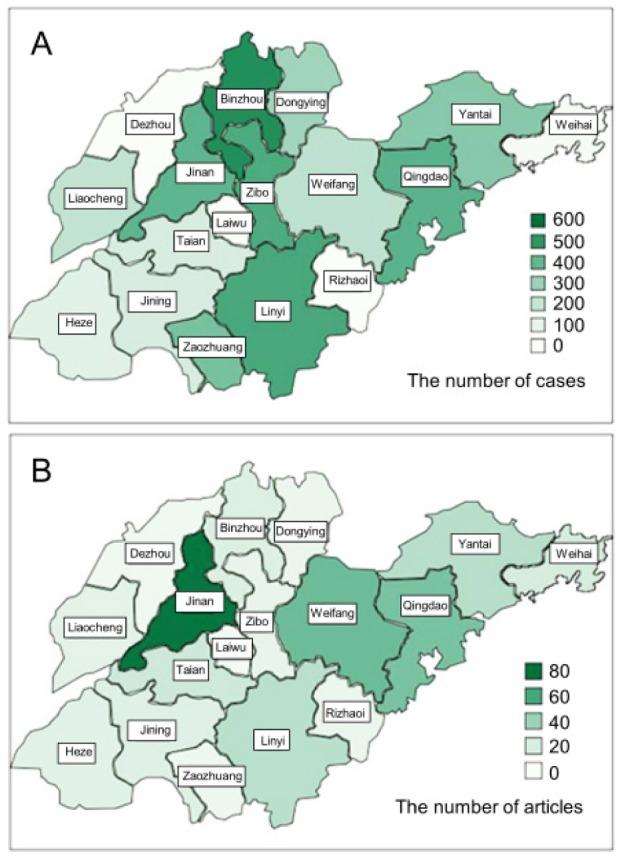
Figure 2.

Geographical distribution of rare diseases onthose diseases. (A), Shown is the distribution of cases in each city; (B), Shown are locations where articles on rare diseases are published. Color shades indicate degree.

Geographical distribution of rare diseases onthose diseases. (A), Shown is the distribution of cases in each city; (B), Shown are locations where articles on rare diseases are published. Color shades indicate degree.