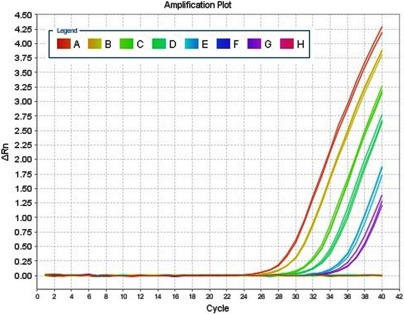
Figure 1.

Quantitative real-time PCR. Amplification plots obtained using quantitative real-time PCR for the SRY gene. A: 500GE; B: 100GE; C, D, and E: positive samples; F: negative controls; G: 10GE; H: negative samples. The X-axis denotes the cycle number of a quantitative PCR reaction. The Y-axis denotes ΔRn, which is the fluorescence intensity over the background.
