
Figure 2.
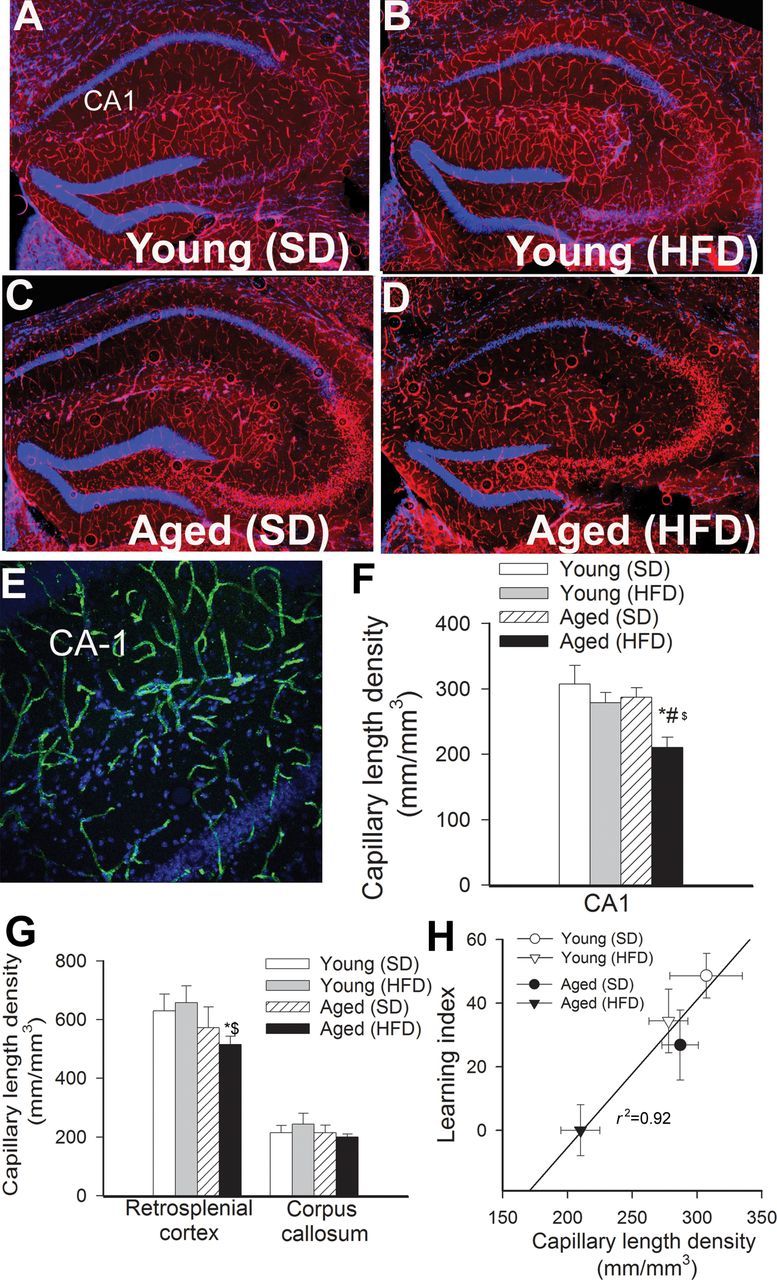
Obesity-induced changes in cerebral capillary density in aging. (A–D) Representative confocal images showing CD31 positive capillary endothelial cells (red) in the hippocampi of young and aged mice fed an HFD or SD. Hoechst 33342 was used for nuclear counterstaining (original magnification: ×5). (E) Representative confocal microscopic analysis of CD31 positive capillaries (green) in the CA1 region of the hippocampus of an obese aged mouse (original magnification: ×20). (F and G) Summary data for obesity-induced changes of capillary length density in the CA1 region of the hippocampus (F), retrosplenial cortex and corpus callosum (G) of young and aged mice. Data are given as mean ± SEM. *p < .05 vs young mice (SD), # p < .05 vs aged mice (SD), $ p < .05 vs young mice (HFD). (H) Relationship between capillary length density in the CA1 region of the hippocampus of young and aged mice fed an HFD or SD and the learning index obtained in these group of animals.