
Figure 4.
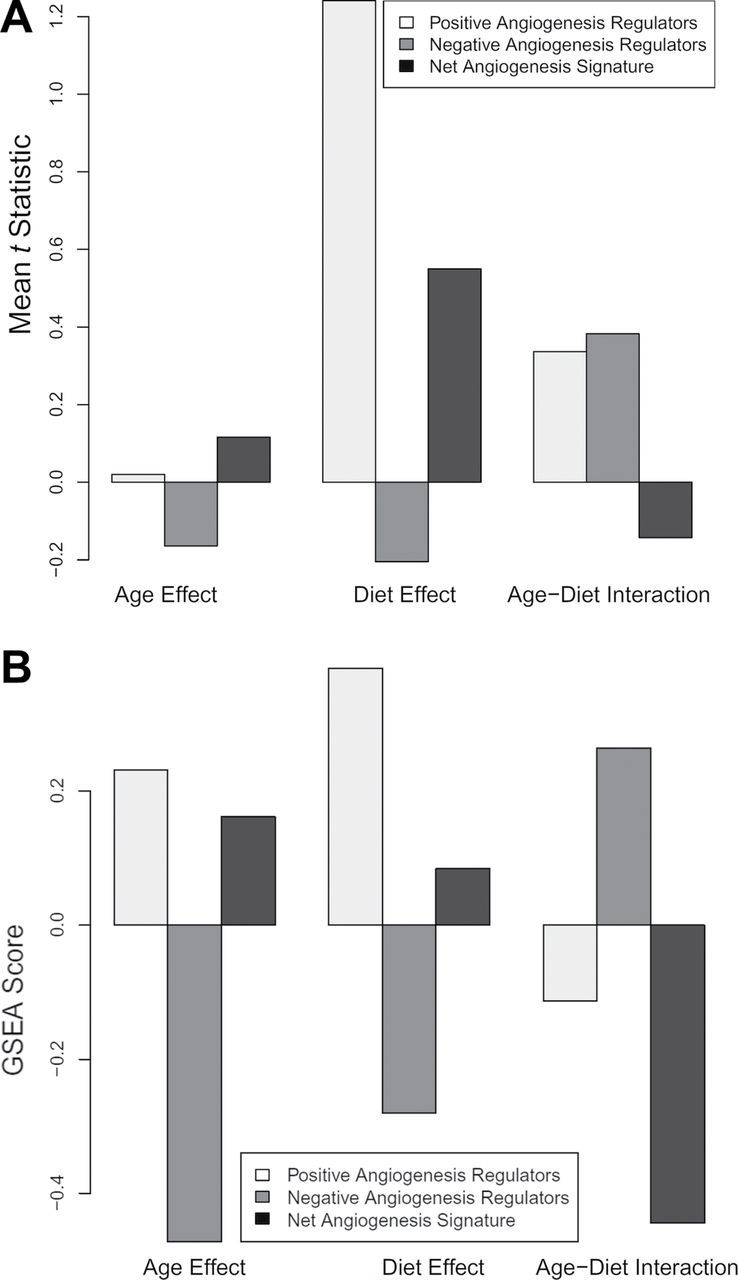
Panel A: Mean t statistic for positive and negative angiogenesis regulators and the signed aggregate of both groups. Panel B: Gene set enrichment analysis (GSEA) scores for positive and negative regulators of angiogenesis and the signed aggregate of both groups. HFD appears to increase the angiogenesis signature, age and the age–diet interaction appear to have mixed effects, whereas the age–diet interaction shows a trend toward decreased angiogenic signature. “Age Effect” refers to old vs young, “Diet Effect” refers to HFD vs control, and “Age–Diet Interaction” refers to the changes in gene expression that occur with the combination of age and HFD that cannot be accounted for by age or diet alone.