
Figure 6.
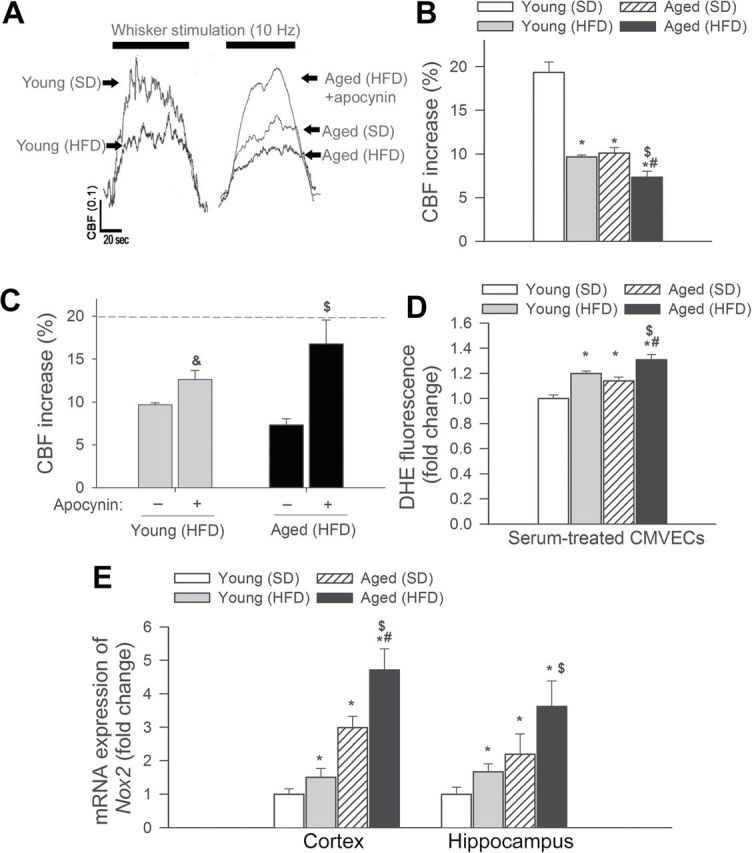
Obesity-induced neurovascular uncoupling and upregulation of NADPH oxidase in aged mice. (A) Representative traces of cerebral blood flow (CBF) measured with a laser Doppler probe above the whisker barrel cortex during contralateral whisker stimulation (1min, 10 Hz) in young and aged mice fed an HFD or SD (0.1 AU corresponds to ~5% increase in CBF from baseline). Panel B depicts the summary data of the effect of HFD-induced obesity on CBF responses to whisker stimulation in young and aged mice. Data are given as mean ± SEM (n = 8 in each group). *p < .05 vs young mice (SD), # p < .05 vs aged mice (SD), $ p < .05 vs young mice (HFD). (C) Summary data of the effect of apocynin on CBF responses to whisker stimulation in HFD-fed young and aged mice. p < .05 vs young mice (HFD), $ p < .05 vs aged mice (HFD). (D) Summary data showing flow cytometric analysis of dihydroethidium fluorescence (indicating reactive oxygen species production) in primary CMVECs treated with sera collected from young and aged mice fed an SD or an HFD. Data are given as means ± SEM (n = 6 in each group). *p < .05 vs young mice (SD), # p < .05 vs aged mice (SD), $ p < .05 vs young mice (HFD). (E) Effects of obesity on mRNA expression of NADPH oxidase subunit Nox2 in the hippocampi and cerebral cortex of young and aged mice fed an SD or an HFD. Data are given as mean ± SEM (n = 5 in each group). *p < .05 vs young mice (SD), # p < .05 vs aged mice (SD), $ p < .05 vs young mice (HFD).