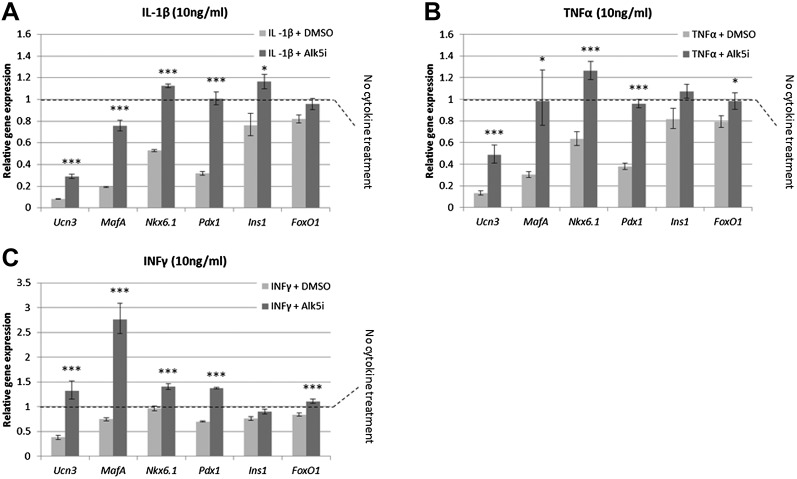
Figure 6. Alk5 inhibitor II induces expression of mature β cell transcription factors and prevents their reduction under cytokine stress.
Quantitative Real-Time PCR analysis of gene expression in wild-type islets treated with cytokines as shown (A) IL-β, (B) TNFα, (C) INFγ. Each bar represents average gene expression in three independent experiments. Expression levels are normalized to the levels of control islets not treated with any cytokine (dashed line). Statistical significance relates to the difference between Alk5i-treated and DMSO-treated islets for each gene. Error bars represent ±SEM. *p < 0.05; ***p < 0.005.


