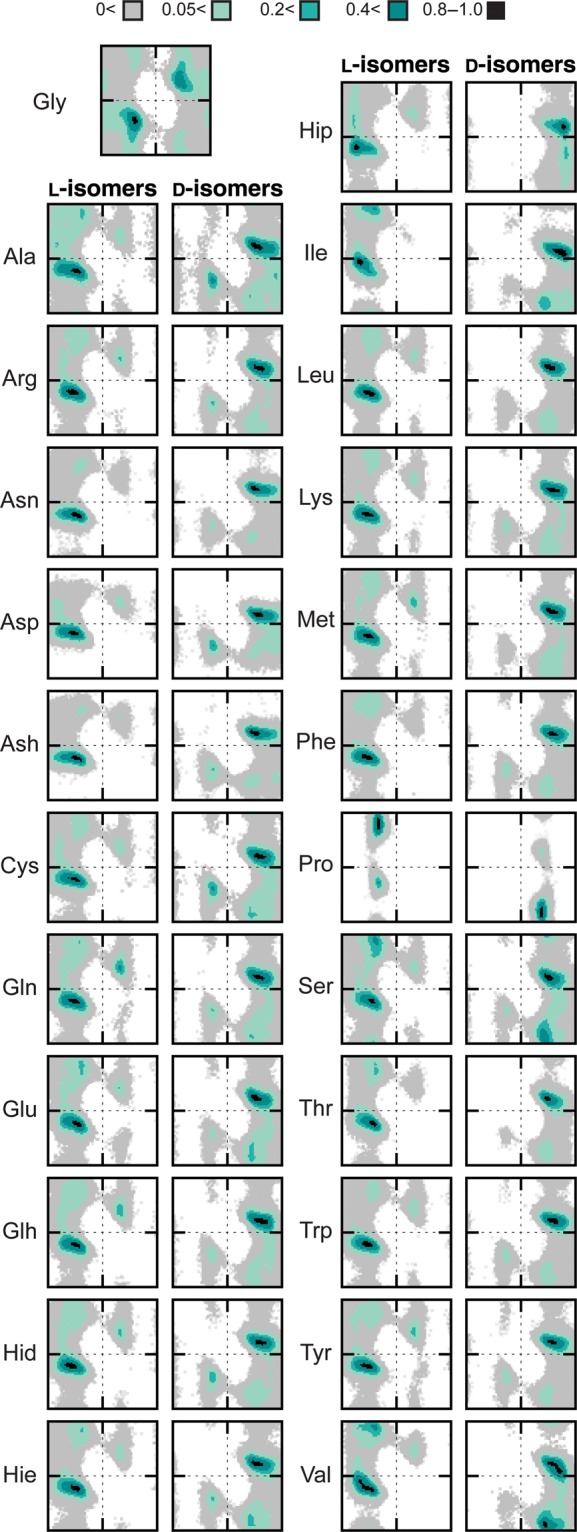
Fig. 2.

Sampling of conformational space by the guest l- and d-amino acids. Ramachandran plots of the conformational populations of the guest residues in all #1 simulation runs. The conformational regions are colored by increasing percentage population and normalized on a scale of 0–1; legend is inset.
