Fig. 1.
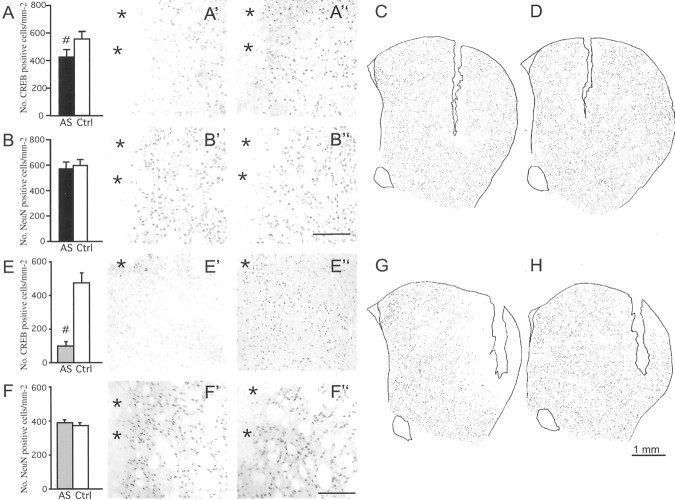
Different methods of CREB antisense delivery produce different extents of CREB knockdown in the striatum. The effects of single oligonucleotide injections are shown inA–D, whereas those produced by a 14 d oligonucleotide infusion are shown inE–H. The number of CREB-immunoreactive cells in the region flanking the injection cannula is shown inA (single injection) or E (continuous infusion), and the corresponding photomicrographs are shown inA′ or E′ (antisense group), andA" or E" (control oligonucleotide). NeuN-immunoreactive neurons within the same regions are shown inB–B" andF–F". Camera lucida drawings illustrate the regional distribution of CREB knockdown after single oligonucleotide injection (C, antisense;D, control) or continuous oligonucleotide infusion (G, antisense; H, control).#p < 0.01; n ≥ 7 in all groups; values give means + SEM. Asterisks inA′, A", B′,B", E′, E", F′, andF" mark the cannula track. AS, CREB antisense;Ctrl, control oligo. Scale bars in B" andF", 200 μm.

