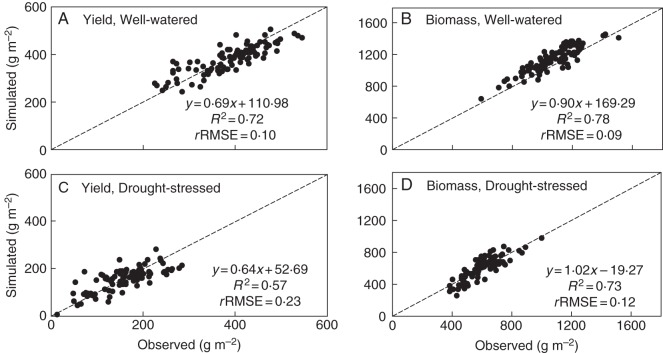
Fig. 3.
Comparison between observed and simulated values of grain yield (A, C) and biomass (B, D) of rice introgression lines for both well-watered (A, B) and drought-stressed (C, D) environments. The simulation was based on the phenotypic values of seven parameters (Table 1) estimated from the 2009 experiment. The diagonal line is the 1:1 line.

