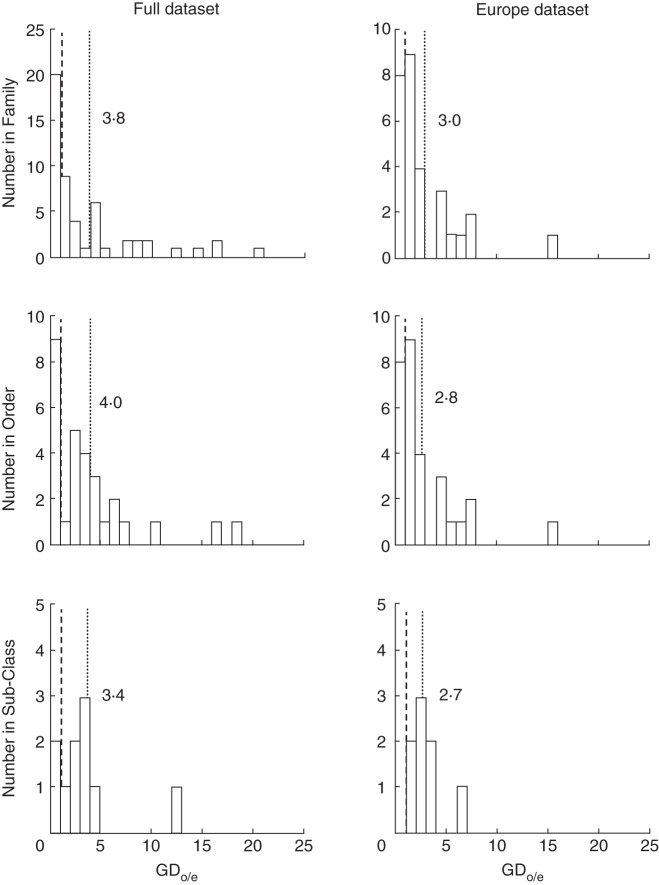
Fig. 1.
Distribution of the ratio of observed vs. expected number of genera with both gynodioecious and dioecious species (GDo/e) at different taxonomic levels. Only taxa for which the GDo/e can be computed were included. The results are shown for ‘Full’ and ‘Europe’ datasets, with the mean GDo/e indicated by a dotted line. GDo/e = 1 is indicated by a dashed line.

