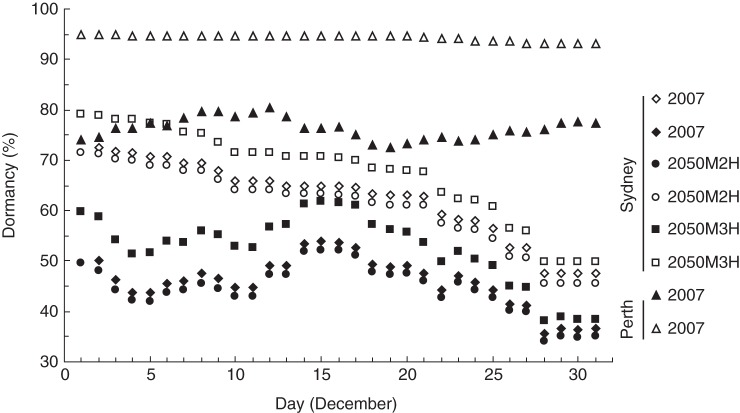
Fig. 5.
Estimated seed bank dormancy as a function of the date ripening commences averaged over the years 1972–2007. Dormancy was estimated for each year in the 34-year sequence from the minimum humidity occurring in a nominal 2-week ripening period using the equation in Fig. 3. Diamonds represent averages calculated from weather records at Sydney Airport. Circles and squares are the estimated averages in the future (nominally 2050) based on, respectively, the CSIRO Mark 2 and Mark 3 climate models, assuming a high carbon emissions scenario (Hennessey et al., 2005). Triangles represent the corresponding averages for Perth (south-west Australia) for the period 1972–2007. Closed symbols represent statistics for a nominal 2-week pre-dispersal period. Open symbols represent statistics for the pre-dispersal period through to the end of January.

