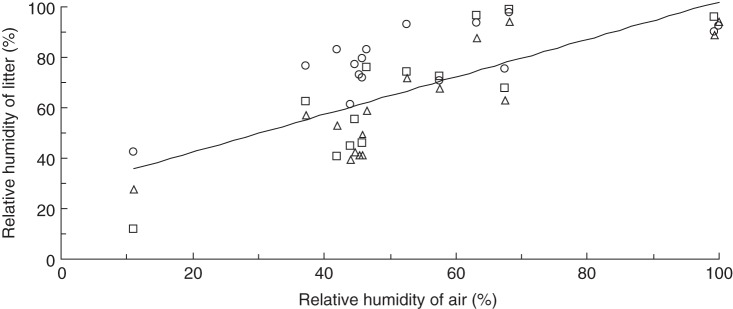
Fig. 6.

Daily minimum RH recorded in the litter (y) plotted against the corresponding minimum ambient humidity (x) during the period 24 December 2013 to 10 February 2014. Symbols represent three locations ∼5 m apart (y = 35.8ln(x) – 66·1; r2 = 0·48).
