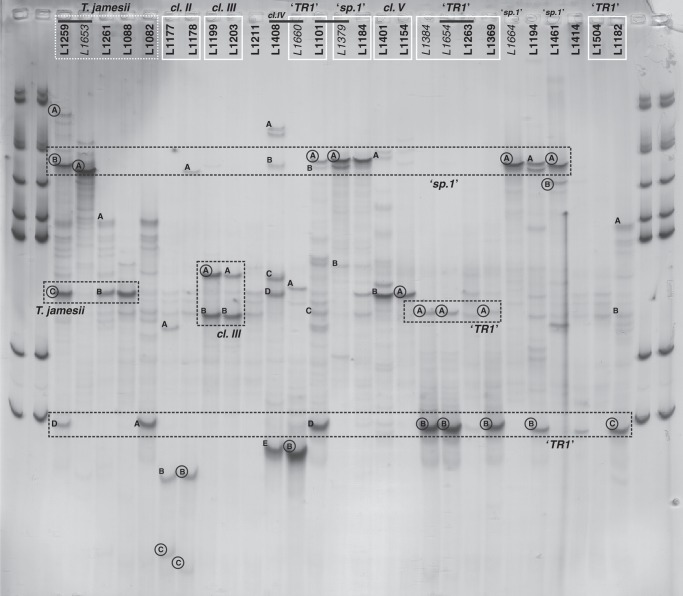
Fig. 3.
Single strand conformation polymorphism (SSCP) analysis of ITS1 fragments of Trebouxia photobionts. Selected samples of Tephromela spp. and cultured photobionts were analysed. Bands excised from the gel are marked by letters (A–D); successfully sequenced bands are additionally encircled. Black bars above the numbers join original lichen samples to their corresponding photobiont isolates. The affiliations of the photobiont samples – identified in the Trebouxia phylogeny of Fig. 1 – are reported above the sample numbers and grouped by white lines. The position of SSCP bands corresponding to Trebouxia ‘sp.1’ and Trebouxia ‘TR1’ sequences (as they are the most frequent bands) is shown by black dashed lines.

