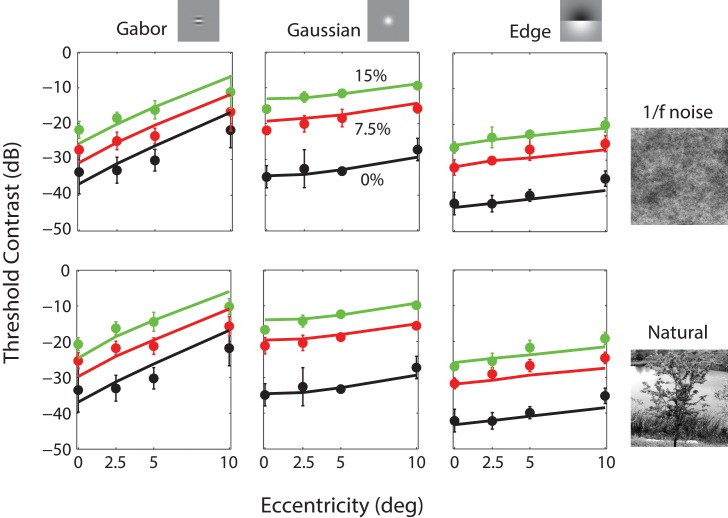
Figure 11.
Predictions for the data from the present Experiment. Data points are the average contrast thresholds of three observers for 60 different conditions (three targets × four eccentricities × three background contrast levels for two kinds of background; the 0% background contrast is a uniform field, and hence, the black points are the same in the upper and lower plots). Error bars represent ±2 standard errors (across observers). Parameter values: kc = 1, ks = 10.1, wc = 0.53, ρ = 2.4, β = 1.685, P0 = 4.45E−4, σl = 1°, kb = 25, wb = 0.962. The first six parameters are the same as in Figure 10 except for P0, which accounts for (modest) differences in overall sensitivity between groups of observers (RMS error = 2.27 dB).

