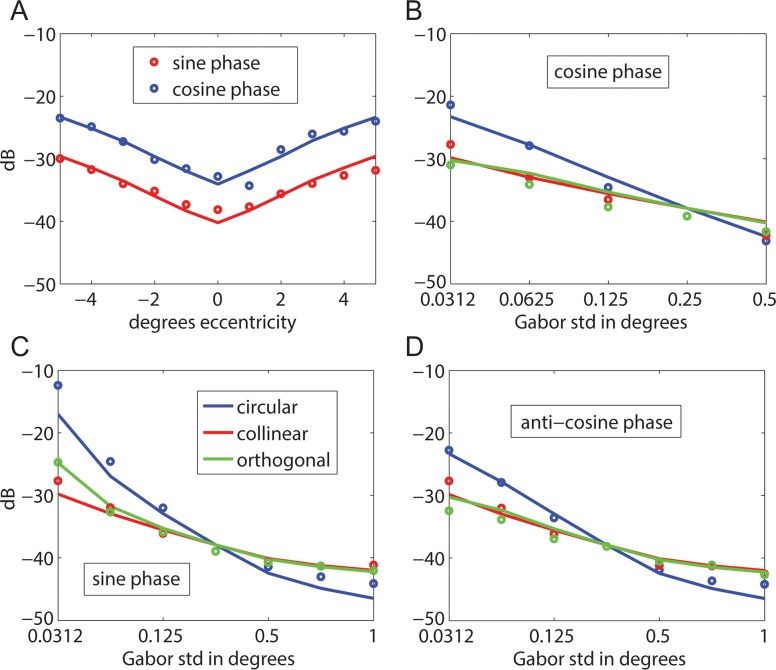
Figure 12.
Predictions for data from Foley et al. (2007). (A) Threshold as a function of eccentricity for 4 c/° radially symmetric Gabor targets in sine phase (envelope SD = 0.25°; two observers; P0 = 5.4E−4) and cosine phase (envelope SD = 0.18°; three observers; P0 = 1.3E−3). (B–D) Threshold as a function of envelope SD for 4 c/° Gabor targets with a circular envelope, an envelope elongated collinear with the grating, and an envelope elongated orthogonal to the grating (two observers; P0 = 9.2E−4). Solid curves are the predictions of the RV1 model with the same parameters as in Figure 10 except for P0, which accounts for (modest) differences in overall sensitivity between groups of observers (RMS error = 1.28 dB).

