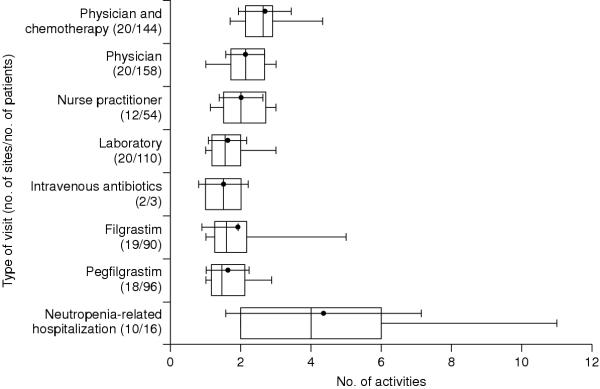
Figure 2.

Life activities affected by medical visits Life activities affected by medical visits, with the point and bar indicating the mean and standard deviation, the vertical line indicating the median, the limits of the box indicating the 25th and 75th percentiles, and the extensions indicating the range. Not all types of activities were reported at all sites (N = 20) or by all patients (N = 189).
