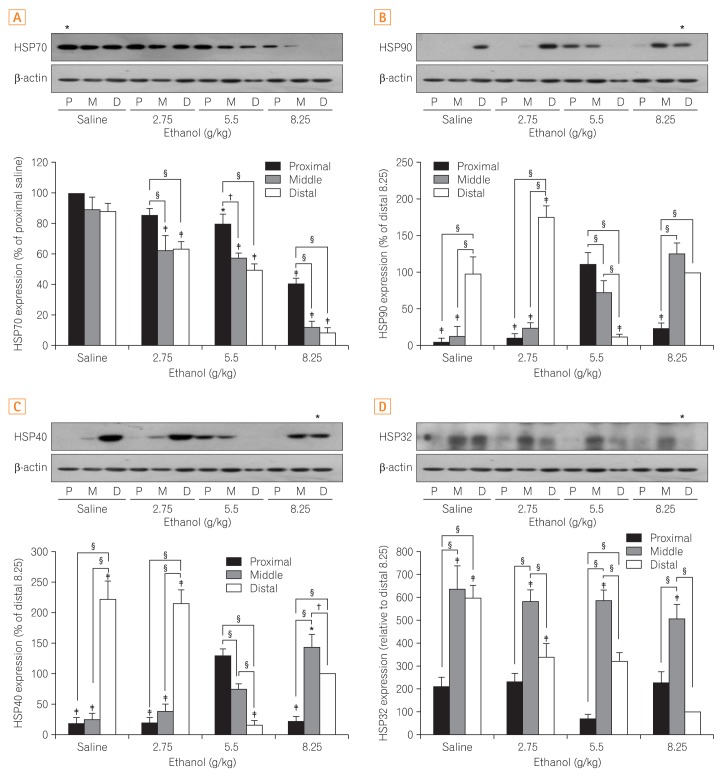
Fig. 2.
Comparison of the differences in expression of heat shock proteins (HSPs) in the small intestine. (A) HSP70, (B) HSP90, (C) HSP40, and (D) HSP32. The upper part of each figure shows the representative bands indicative of changes in the expression of HSPs by western blot analysis and the lower part shows a quantitatively obtained graph from the western blot analysis that was repeated 3 times. All results were obtained with 3 independent experiments and values are displayed as mean±SD. * and † indicate P<0.05. ‡ and § indicate P<0.01. P, proximal small intestine; M, middle small intestine; D, distal small intestine.

