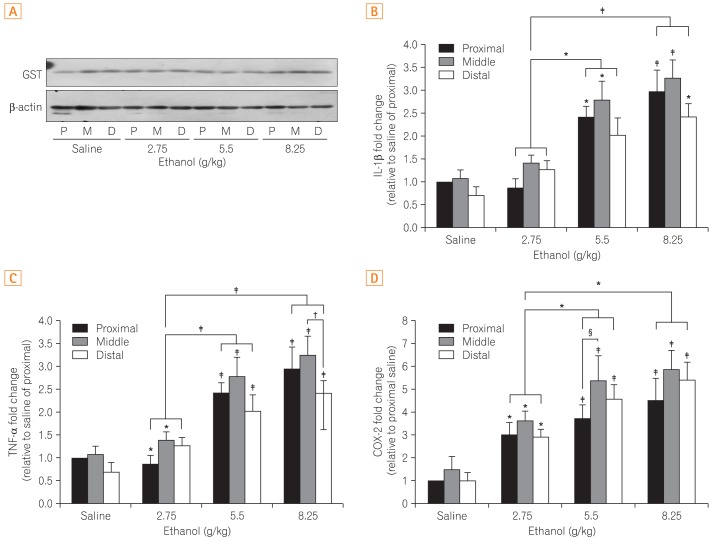
Fig. 3.
Comparison of the differences in the protein expression of (A) glutathione-S-transferase (GST) and (B) mRNA expression of interleukin-1β (IL-1β), (C) tumor necrosis factor-α (TNF-α), and (D) cyclooxygenase-2 (COX-2). Figure 3A shows the representative band indicative of changes in the expression of GST by western blot analysis. Figure 3B, C, and D show results obtained by extracting mRNA via reverse transcription-PCR assay to measure the expression of each gene. All results were obtained with 3 independent experiments and values are displayed as mean±SD. * and † indicate P<0.05. ‡ and § indicate P<0.01. P, proximal small intestine; M, middle small intestine; D, distal small intestine.

