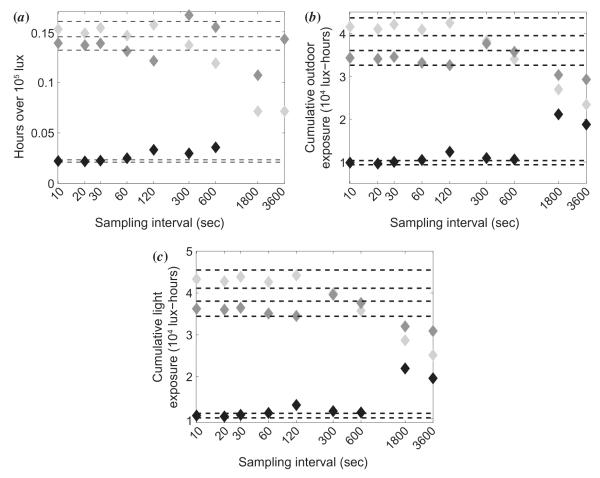
Figure 8.
Effect of different sampling intervals on (a) hours spent in bright sunlight, (b) cumulative outdoor exposure, and (c) total cumulative light exposure. Dashed lines indicate ± 5% of the original values for a 10 s sampling interval. The different grayscale symbols represent three different subjects.

