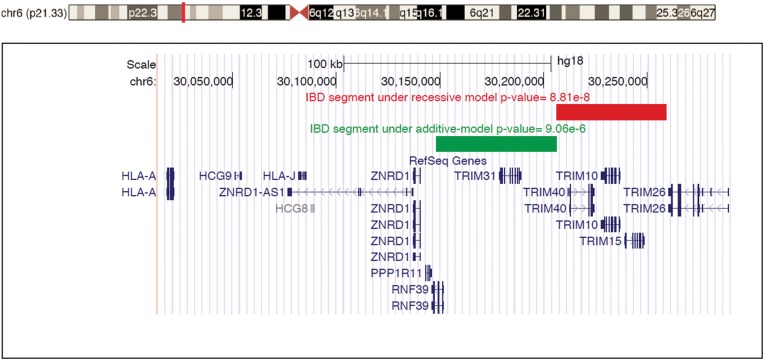
Figure 2.
The most significant homozygous IBD segment under the recessive model (shown as red bar) that was associated with SCZ. The top signal was localized to TRIM10, TRIM15 and TRIM40. The green bar represents the IBD segment with the strongest P-value under the additive model, localized to RNF39 and TRIM31.

