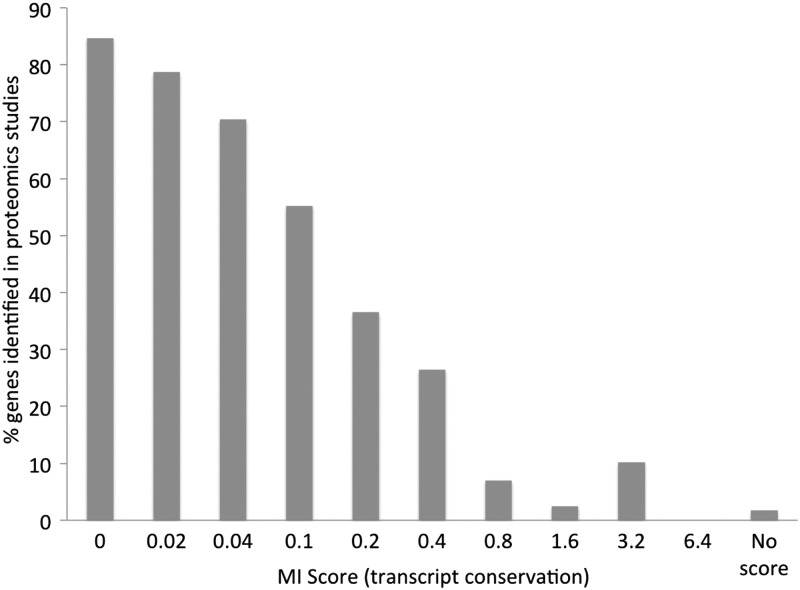
Figure 1.
The percentage of gene products detected in proteomics experiments as a function of gene conservation. Gene conservation is expressed using MI score, displayed in bins. Bin ‘0’ is MI scores from 0 to 0.019, ‘0.02’ is from 0.02 to 0.039, etc. The ‘missing’ genes are those where the conservation was so poor that INERTIA was not able to generate a score.

