
Figure 5.
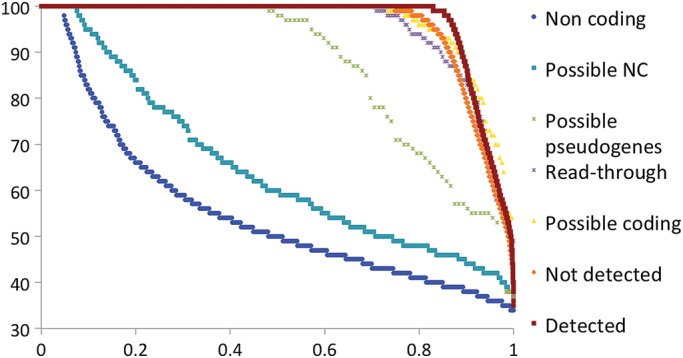
RFC scores for genes from potential NC set. The RFC scores were calculated as per the section Materials and methods for alignments between human and mouse only. We split the Potential NC set genes that we could classify into 4 groups, those 342 genes that we felt were likely protein-coding genes (Possible coding), the 396 genes that we felt were possible pseudogenes (Possible pseudogenes), the 229 read-through genes and those 969 genes that we felt were likely to be non-coding (Possible non-coding). We compared these four sets against three background sets, those protein-coding genes for which we found peptides (Detected in dark red), those coding genes for which we did not find peptides and that were not in the potential non-coding set (Not Detected genes, in orange) and a set of long non-coding genes (Non-coding shown in blue). RFC scores are shown on the y-axis; the x-axis in all the figures is the proportion of all the valid pairwise alignments included in the RFC calculations. RFC scores are ordered from highest to lowest.