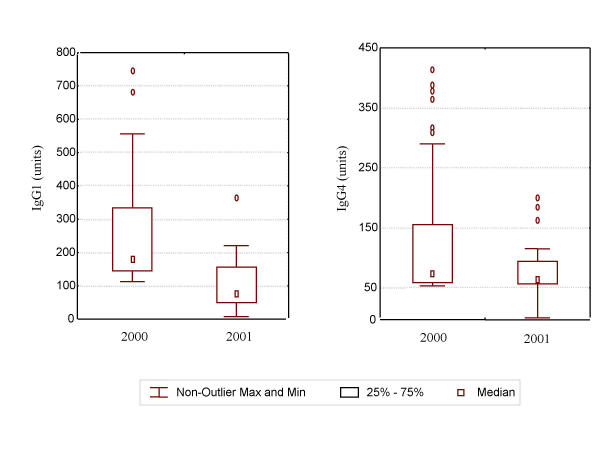
Figure 4.
Change in antifilarial antibody response among antibody positive persons who received treatment by year. The error bars represent the non-outlier maximum and minimum values. Outliers were more than 3 standard errors away from the mean. There was a significant decrease in antifilarial IgG1 responses (p < 0.001).

