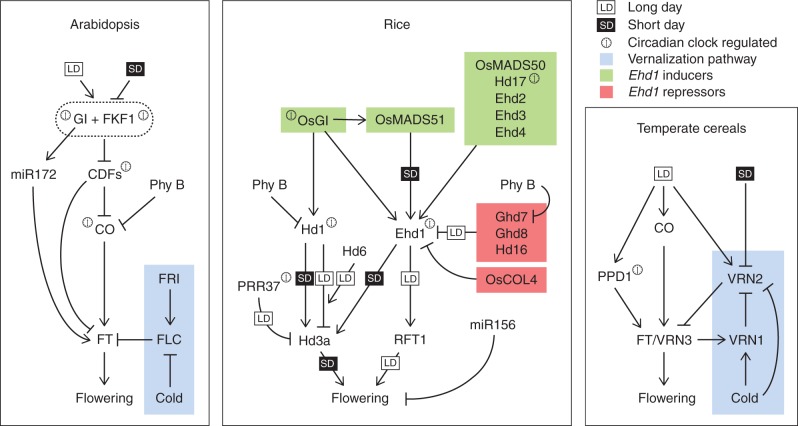
Fig. 1.
Simplified regulatory networks controlling florigen production in leaves of different plant species. Networks of arabidopsis (left panel), rice (central panel) and temperate cereals (right panel) are compared. Small white and black boxes indicate regulatory connections occurring primarily under LDs and SDs, respectively. Arrows indicate transcriptional activation, whereas flat-ended arrows indicate transcriptional repression. The blue boxes in both the arabidopsis and the temperate cereal models include genes involved in vernalization responses. The green and red boxes in the rice model include positive and negative regulators of Ehd1 expression, respectively. A clock symbol close to a gene indicates that its transcription is controlled by the circadian clock.

