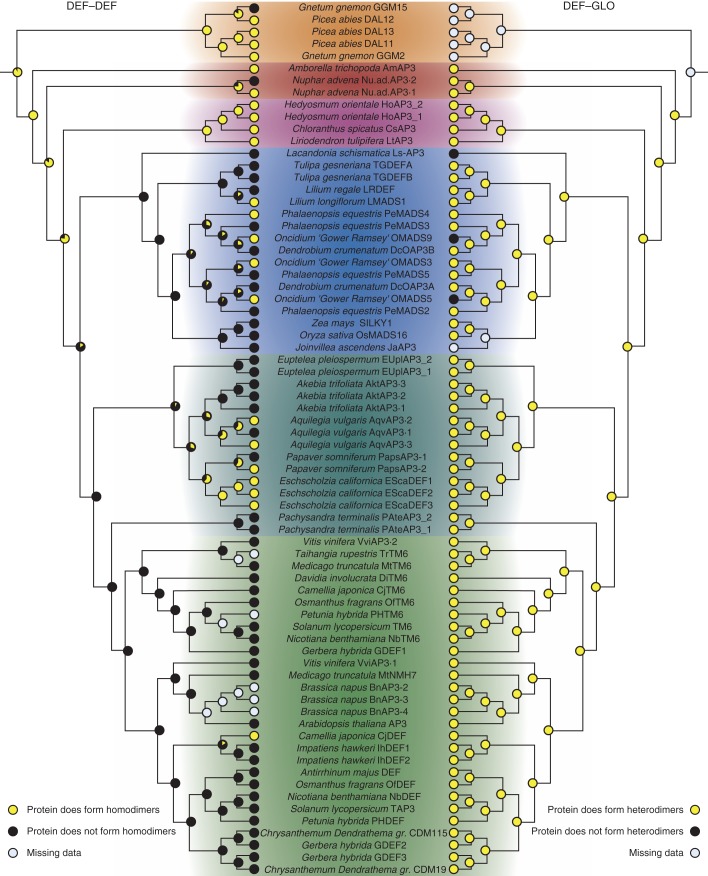
Fig. 5.
Ancestral character-state reconstruction for the ability of DEF-like proteins to form homo- and heterodimeric complexes. Trees are in general based on the APG III phylogeny as described in the Materials and Methods. The tree on the left depicts character-state reconstruction for the homodimerization capability of DEF-like proteins. The tree on the right has the same topology as the tree on the left but shows character-state reconstruction for heterodimerization of DEF-like proteins with GLO-like proteins. Yellow circles at the terminal positions indicate the presence of an interaction, and black circles indicate the absence of an interaction. Grey circles indicate that interaction data are not available for that particular protein. The likelihood of an interaction at internal nodes is indicated by pie charts. Proteins from different plant groups are highlighted in colours as in Fig. 1. Colour coding is as follows: gymnosperms, orange; early-diverging angiosperms, red; magnoliids, purple; monocots, blue; early-diverging eudicots, dark green; core eudicots, light green

