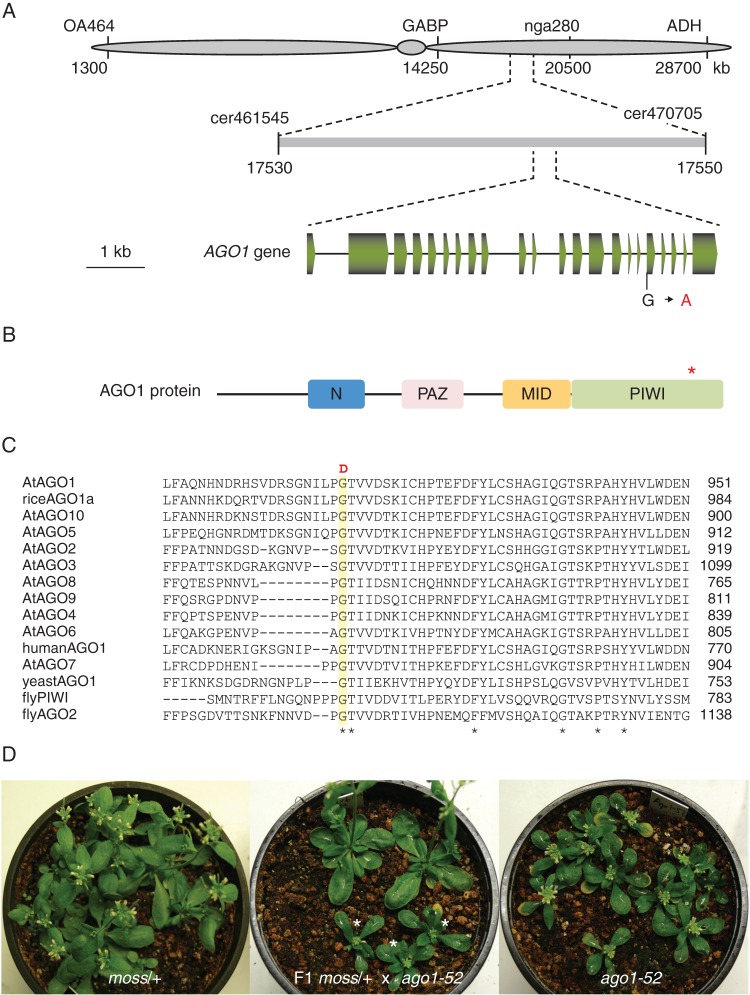
Fig. 3.
Cloning of the moss mutation. (A) Positional cloning of the moss mutation. Some of the markers used for linkage analysis are shown. (B) Schematic representation of the structure of the AGO1 protein, with indication of the N, PAZ, MID and PIWI domains. An asterisk indicates the position of the amino acid affected by the moss mutation. (C) Multiple alignment of the region of the arabidopsis AGO1 protein [AtAGO1 (O04379)] affected by the moss mutation with those of other AGO family members from Arabidopsis thaliana [AtAGO2 (Q9SHF3), AtAGO3 (Q9SHF2), AtAGO4 (Q9ZVD5), AtAGO5 (Q9ZVD5), AtAGO6 (O48771), AtAGO6 (Q9C793), AtAGO8 (Q3E984), AtAGO9 (Q84VQ0) and AtAGO10 (9XGW1)], Oryza sativa [riceAGO1a (Q6EU14)], Homo sapiens [humanAGO1 (Q9UL18)], Saccharomyces pombe [yeastAGO1 (O74957)] and Drosophila melanoganster [flyPIWI (Q9VKM1) and flyAGO2 (Q9VUQ5)]. Amino acid residues conserved in all the sequences are marked with an asterisk. The residue changed by the mutation in the moss mutant (G-D), shaded in yellow, is conserved in all the protein sequences. (D) moss/AGO1 heterozygotes (left), ago1-52/ago1-52 homozygotes (right) and their F1 progeny (centre), among which moss/ago1-52 heterozygotes segregated in a 1:1 (phenotypically mutant:wild-type) ratio. The latter was considered evidence of allelism.

