Figure 2.
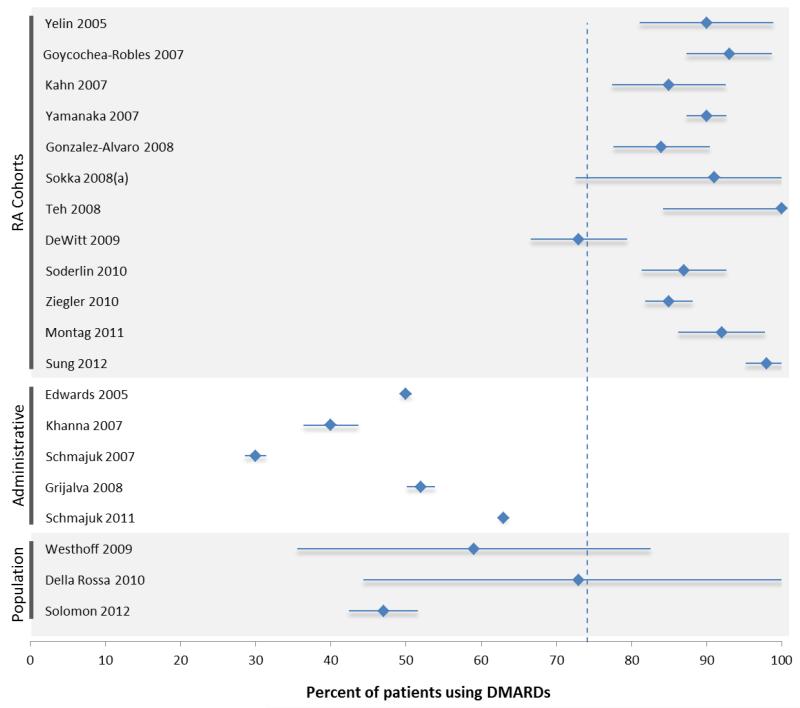
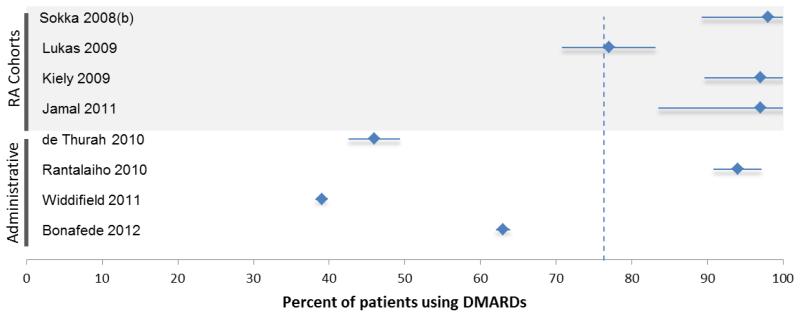
Graphical representation of the percent of patients using DMARDs reported in each study of patients with (A) established and (B) early rheumatoid arthritis. The x-axis ranges from 0-100 percent. The vertical dotted line represents the mean percent DMARD use in the studies within the figure: The mean for established RA studies was 74%; the mean for early RA studies was 76%. The studies have been sorted according to patient source. Figure 2A shows RA cohorts or registries in the top panel, administrative studies in the middle panel, and population-based surveys in the bottom panel. Figure 2B shows RA cohorts or registries in the top panel and administrative studies in the bottom panel. Each study listed shows a diamond and a horizontal “error bar” line – the diamond represents the reported percent of patients in each study who are taking DMARDs; the error bar lines indicate the 95% confidence intervals, which are inversely proportional to the sample size of the study (i.e., small studies have wide error bars; large studies have narrow error bars).
The percent of patients using DMARDs reported in each study of patients with established RA, stratified by data source.
The percent of patients using DMARDs reported in each study of patients with early RA, stratified by data source.


