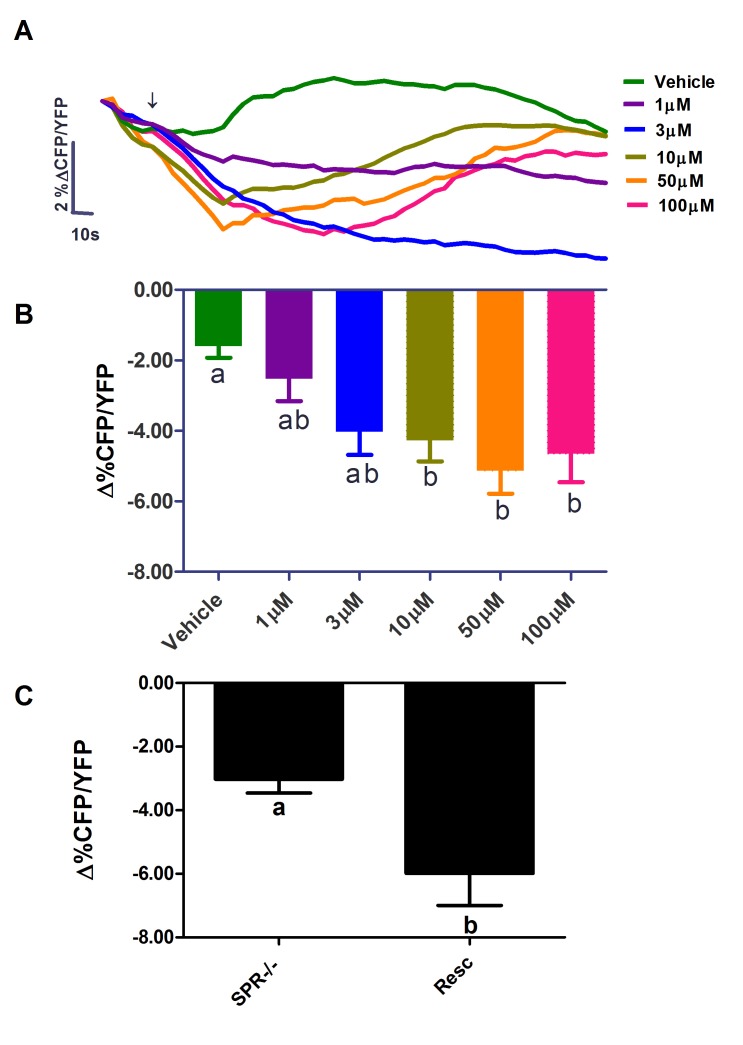
Figure 4. MIP modulates cAMP dynamics of l-LNvs through SPR.
(A) Averaged Epac1-camps YFP/CFP FRET plots of l-LNvs from pdf-Gal4,UAS-Epac1-camps flies in response to various MIP doses applied as indicated by the arrow. The average drift in CFP/YFP ratio displayed by 28 untreated neurons from 11 brains, imaged identically to those treated with MIP and vehicle, were subtracted from the plots in (A) to correct for the effects of photo-bleaching. (B) A summary of the average maximum loss of Epac-1-camps CFP/YFP between 30 and 120 s for the data shown in (A). A one-way ANOVA revealed a significant effect of MIP concentration (p<0.0001) on the maximum loss of CFP/YFP ratio. A Dunn's multiple comparison test revealed significant differences (p<0.05) between vehicle controls and the 10, 50, and 100 µM MIP treatments. The sample sizes for (A) and (B) were as follows: for vehicle, 24 neurons from 14 brains (24, 14), 1 µM MIP (14, 8), 3 µM MIP (16, 3) 10 µM MIP (20, 11), 50 µM MIP (20, 10), and 100 µM MIP (12, 9). (C) The l-LNvs of SPR-deficient mutants (SPR−/−,pdf-Gal4,UAS-Epac1-camp) do not display an obvious loss of Epac1-camps CFP/YFP signal in response to 50 µM MIP (compare to B). However the rescue of SPR expression within the l-LNvs (SPR−/−,pdf-Gal4,UAS-Epac1-camp,UAS-SPR) results in wild-type like responses to MIP. An unpaired t-test revealed a significant difference between the effects of 50 µM MIP on SPR−/− mutant and SPR rescued l-LNvs (P = 0.007). Sample sizes: SPR−/− (15, 6), Rescue (11, 5). For (B) and (C) error bar represent SEM. The letters “a” and “b” in (B) and (C) denote significantly different groups.

