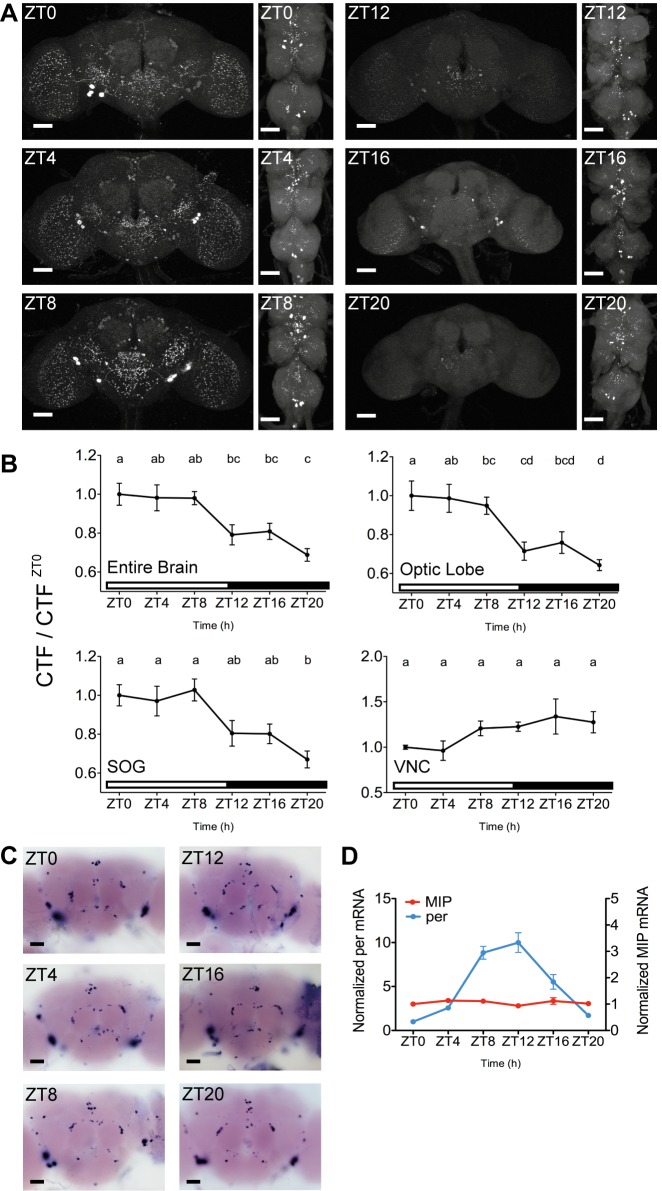
Figure 5. Comparisons between MIP protein and mRNA levels suggest synchronized and massive secretion of MIP occurring in the brain between ZT 8 and ZT 20.
(A) Representative confocal images of anti-MIP staining of the w1118 male brain (left) and the ventral nerve cord (VNC, right), isolated at six different time points (ZT 0, 4, 8, 12, 16, and 20). (B) Normalized MIP-immunoreactivity of the indicated CNS areas. n = 15–24 (for the brain regions); n = 5–6 (for the VNC). The letters from “a” to “d” indicate significant differences between ZT groups (p<0.05), determined by one-way ANOVA with Tukey's post hoc test. (C) Bright-field images of the male brain stained using in situ hybridization for MIP mRNA transcripts. Scale bars, 50 µm. (D) MIP (red) and per (blue) mRNA transcript levels in the male heads, measured by quantitative reverse transcription PCR and normalized to ZT 0. n = 3. Data are shown as means ± SEM.

