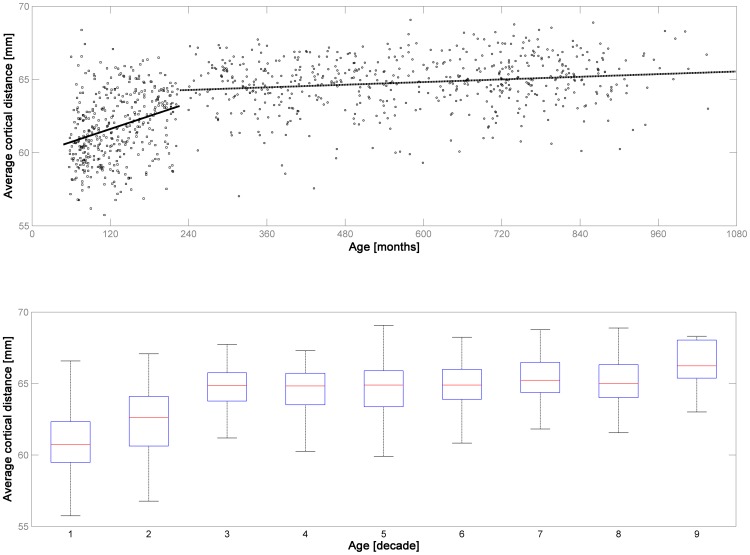
Figure 2. Illustration of the average cortical distance of all subjects in datasets 1 & 2 (structural MRI, n = 964).
Note steep increase in childhood and adolescence (dataset 1, solid trendline in upper panel) and much more shallow increase in adulthood (dataset 2, dashed trendline in upper panel). Lower panel: illustration of the same results per decade of life. The difference between datasets 1 & 2 and of the first two decades with all other decades is significant (see manuscript for more details).

