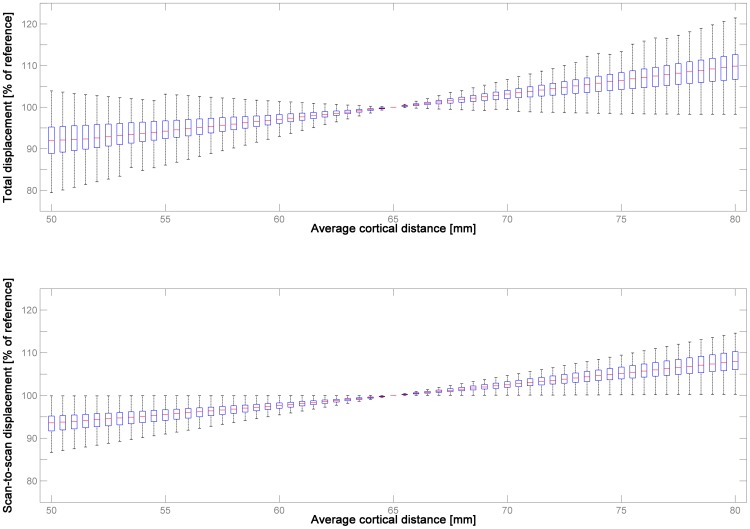
Figure 3. Illustration of the effect of varying average cortical distance on the resulting measure of absolute (total displacement, upper panel) and relative motion (scan-to-scan displacement, lower panel) in dataset 3 (n = 200), using 65 mm as a reference.
Note systematic, but overall small effect, and substantial variability between subjects, underlining the inter-individual variation in ultimate motion trajectory composition.

