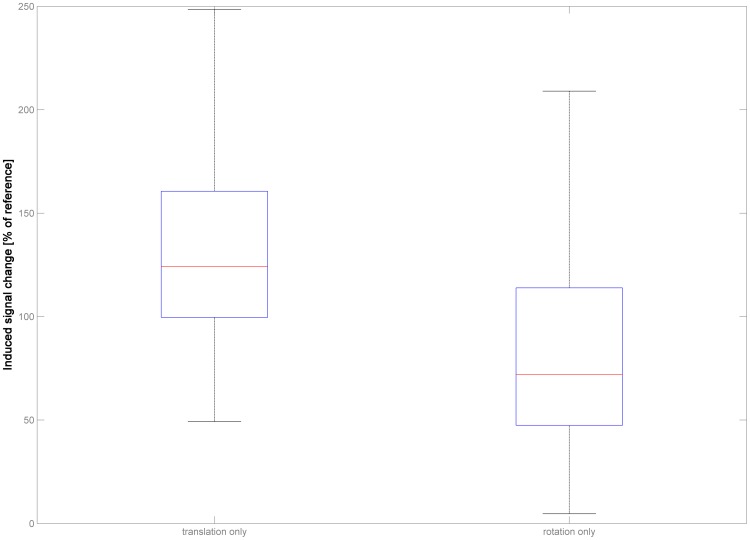
Figure 5. Illustration of the induced signal changes in dataset 3 (n = 200) for the two reduced parameter sets (translationonly, left panel, and rotationonly, right panel).
Note severe deviation from expected observable signal changes when compared with the signal changes induced by the full parameter set ( = 100%).

