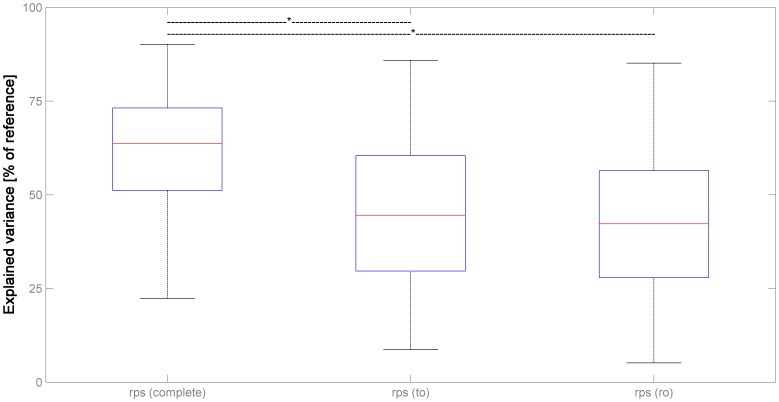
Figure 6. Illustration of the variance explained in dataset 3 (n = 200) by different parameter combinations: complete set of realignment parameters [rps (complete)], realignment parameters from translationonly [rps (to)] and rotationonly [rps (ro)].
Note increasingly severe underestimation of total motion-induced variance when compared with the full parameter set including Volterra expansion ( = 100%); see text for details.

