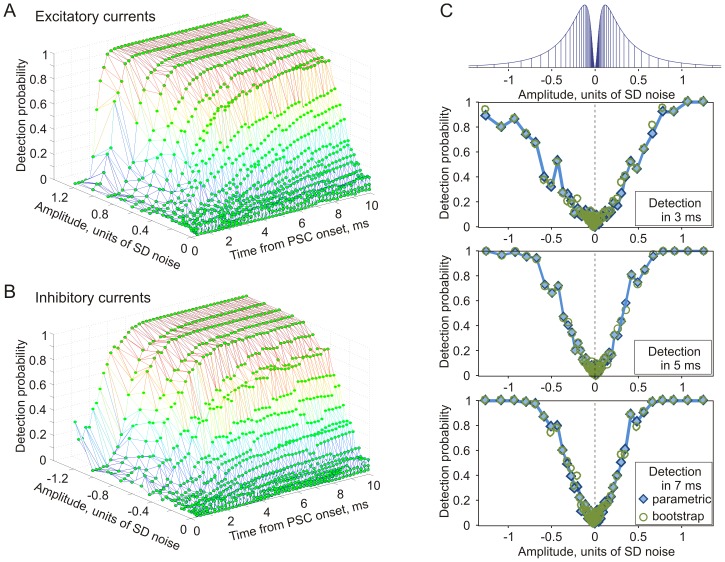
Figure 3. Detection probability of excitatory and inhibitory aPSCs of different amplitudes.
Results from one experiment using the fully defined signal mixture paradigm. A, B: Parametric detection probability of excitatory (A) and inhibitory (B) aPSCs from population firing of N = 1000 neurons as a function of time and amplitude of the aPSC. Results were obtained in a single experiment with fully-defined signal mixture. The amplitudes are plotted in units of standard deviation (SD = 100 pA in this experiment) of the injected fluctuating current. C: Dependence of the detection probability within 3 (top), 5 (middle), and 7 ms (bottom) after aPSC onset on the amplitude of excitatory and inhibitory aPSCs. Diamond symbols denote parametric detection probability (data from A, B), while circles denote detection probability calculated from the same data using bootstrapping. Top: the distribution of PSC amplitudes used to synthetize currents for injection (as illustrated in Fig. 2B).

