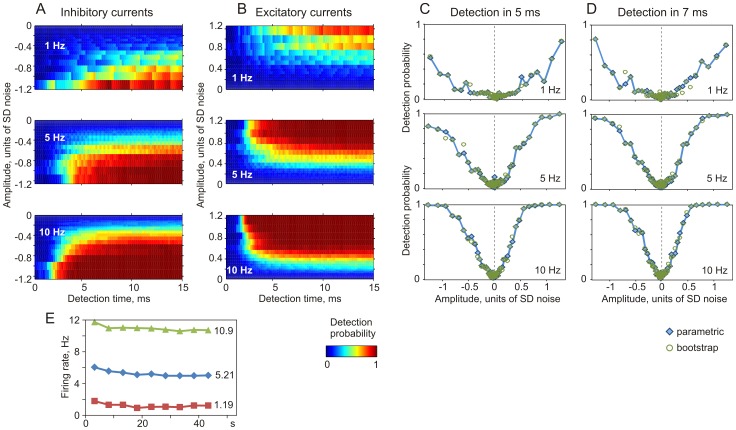
Figure 5. Dependence of the detection probability of inhibitory and excitatory aPSCs on postsynaptic firing rate.
A, B: Parametric probability of detection for inhibitory (A) and excitatory (B) aPSCs from population firing of N = 500 neurons as a function of time and amplitude. Firing rate of neurons in the population was kept around 1 Hz (averaged 1.19 Hz), 5 Hz (5.21 Hz) or 10 Hz (10.9 Hz), as indicated. The amplitudes are plotted in units of SD (SD = 110 pA) of the injected fluctuating current. Detection probability (Z-axis) is color-coded. C, D: Dependence of the detection probability within 5 ms (C) and 7 ms (D) after onset on PSC amplitude. Detection probability calculated parametrically (filled diamond symbols, data from A, B) and using bootstrapping (open circle symbols) from activity of a populations of N = 500 neurons firing at averaged rates of 1 Hz, 5 Hz, or 10 Hz, as indicated. E: Each symbol shows firing rate during 46 s recording episodes, averaged over 5 s intervals. For each target frequency, N = 20 episodes were used; numbers on the right show gross averages.

