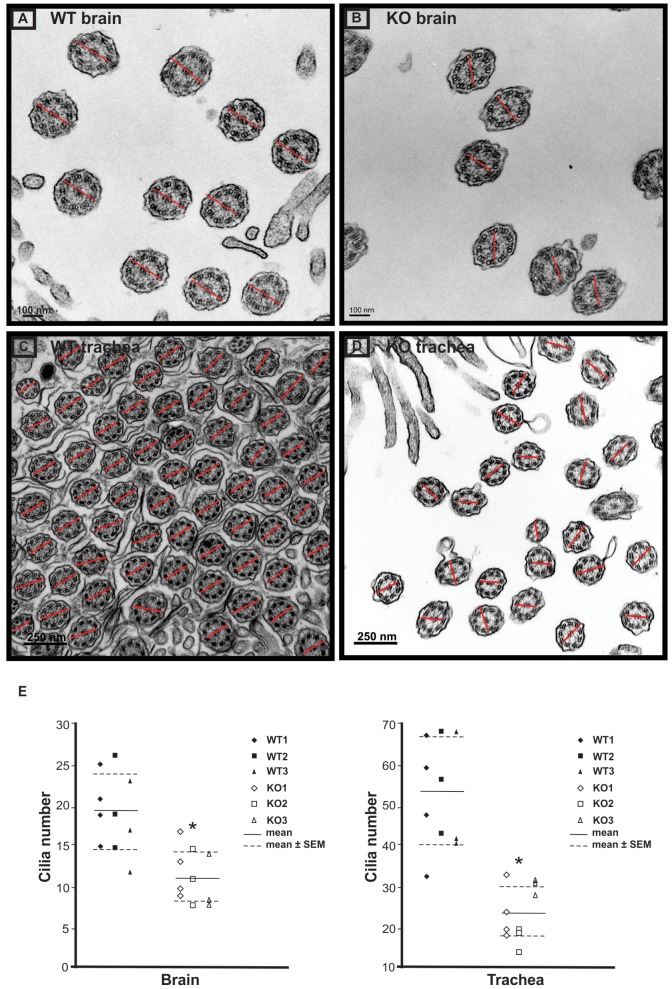
Figure 4. Examination of rotational polarity of ciliary axoneme of brain ependymal cells and trachea epithelial cells by transmission electronic miscroscopy.
Axoneme cross-sectional images were taken with a transmission electron microscope. The rotational polarity of each axoneme was evaluated by the angle of the line connecting the central pair. Notice that the orientation of the lines in wild type mice is similar (A: brain; C: trachea). while the orientation of the lines in the Spag6-deficient mice varies among axonemes (B: brain; D: trachea). E. Average axoneme number counted from ten images randomly selected from each group. Three or four images were counted from each mouse, and three wild-type and three mutant mice were examined. Horizontal lines represent the means and SEMs. * p<0.05.

