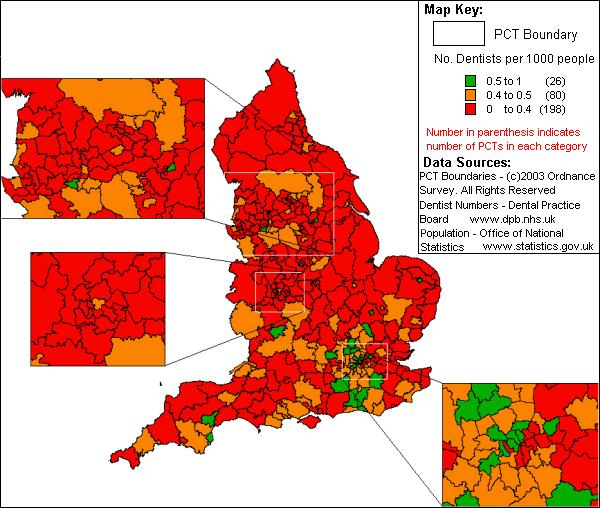
Figure 3.

'Traffic light' map of dentists distribution per 1,000 people by PCT in three classes 'Traffic light' map of England showing the distribution of dentists per 1,000 people by PCT as at 31 December 2002, classified into three classes: 0–0.4 (red = shortage of NHS dentists), 0.4–0.5 (orange-yellow = some shortage of NHS dentists) and 0.5–1 dentist per 1,000 population (green = acceptable/good number of dentists).
