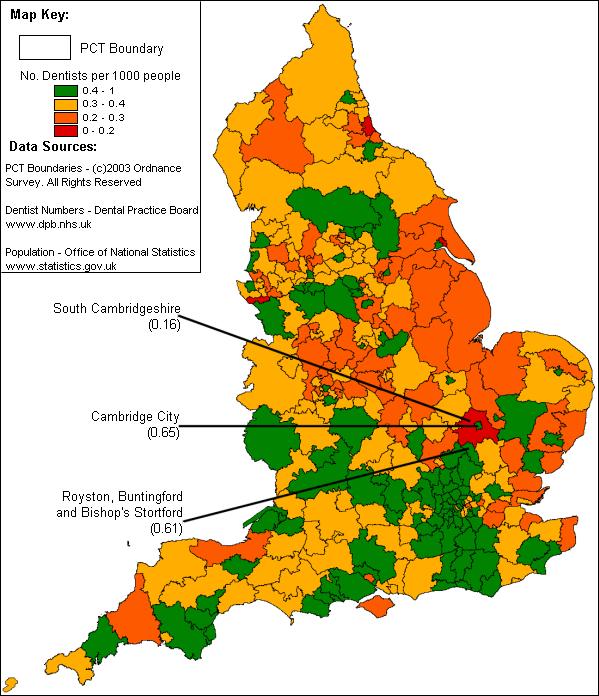
Figure 4.

'Traffic light' map of dentists distribution per 1,000 people by PCT in four classes 'Traffic light' map of England showing the distribution of dentists per 1,000 people by PCT as at 31 December 2002, classified into four classes: 0–0.2 (red = serious shortage of NHS dentists), 0.2–0.3 (dark orange-yellow = shortage of NHS dentists), 0.3–0.4 (light orange-yellow = some shortage of NHS dentists) and 0.4–1 dentist per 1,000 population (green = low, but acceptable or good number of dentists). Note the location of South Cambridgeshire PCT, which has a very low dentist per 1,000 population figure of 0.16, in relation to Cambridge City and Royston, Buntingford and Bishop's Stortford PCTs, which both have a dentist per 1,000 population figure of more than 0.6.
