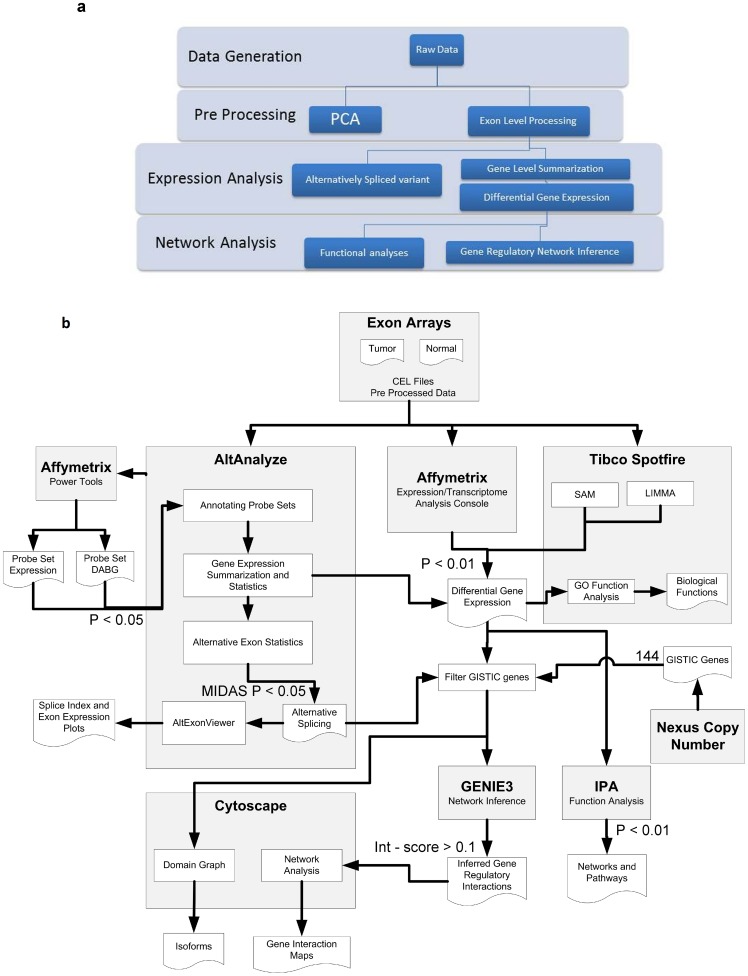
Figure 1. Flow diagram for Analysis Strategy.
A)The entire analyses is categorized into fours stages from ‘Data Generation’ to ‘Network Analyses'. B) Analysis strategy using different programs is displayed in this diagram. There are three components of the analysis – Gene, Exon and Network handled by different programs. Gene level analyses are conducted using ‘Affymetrix, Expression/Transcriptome analysis console’ and ‘Tibco Spotfire’. Exon level analysis is carried out by ‘AltAnalyze’ and ‘Affymetrix power tools’. Network analyses employed ‘GENIE3’, ‘IPA’ and ‘Cytoscape’. ‘Nexus Copy Number’ is a program used in earlier studies to eventually generate a list of 144 driver genes.

