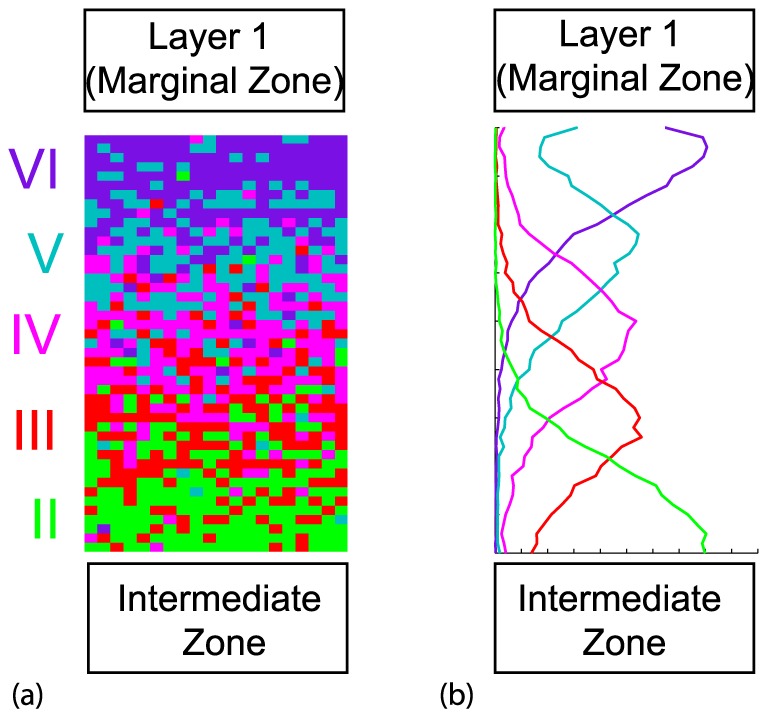
Figure 7. Dab1 mutant type cortical layering.

(a) Model results from a single realization. (b) Model results averaged over 50 realizations. Vertical axis is distance and horizontal axis is agent density. Here the movement rule (b) and conversion rule (ii) were implemented, where the relevant mutant modifications were made. Here:  ,
,  ,
,  ,
,  ,
,  and
and  . Similar results are observed with alternative mechanisms that successfully produce the Dab1 mutant phenotype indicated in Table 1.
