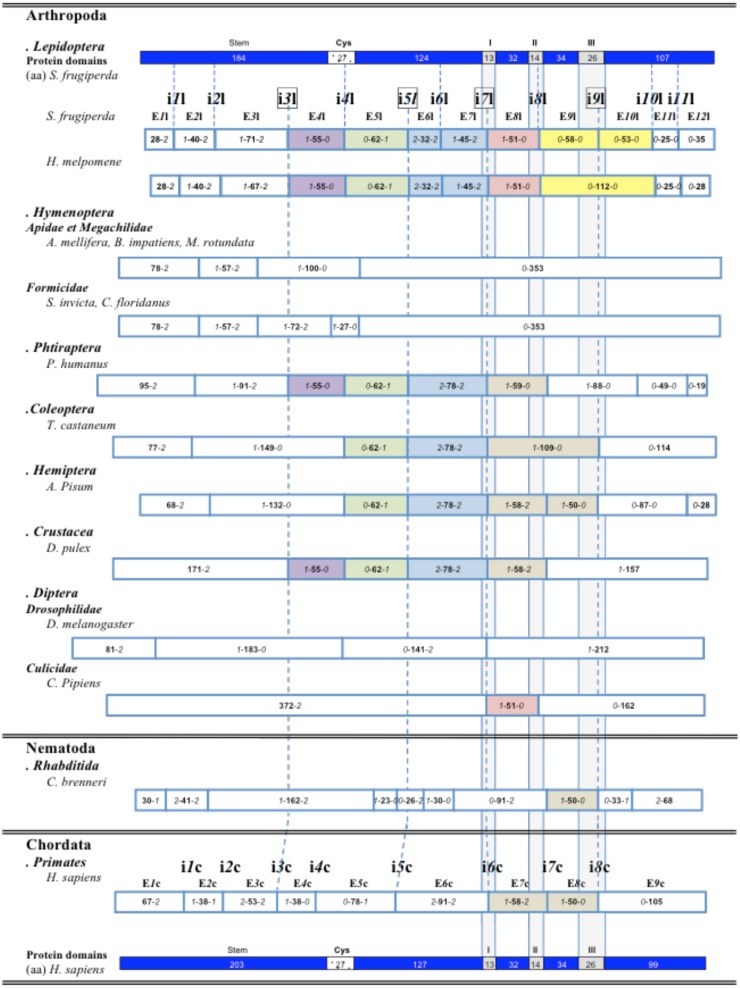
Figure 5. Schematic illustration of the genomic organization of the fut8 genes identified in animal genomes.
Coding exons are represented by rectangles with their relative size in codons (in bold). Italic numbers represent the number of nucleotides belonging to codons that flank the intron insertion site and determine the intron insertion phase. Dashed lines represent conserved intron insertion sites. Conserved exons are in the same color. S. frugiperda and H. sapiens FUT8 proteins are in blue, specific domains are represented by rectangles with their relative size in aa (Cys-rich domain, in black and motifs I, II and III, in grey).

