
Figure 1.
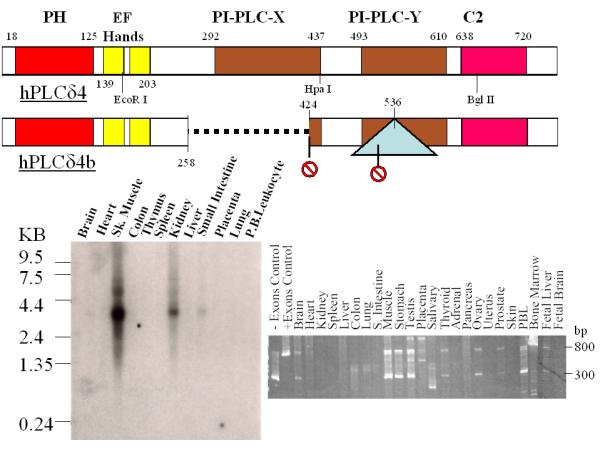
Linear map of hPLCδ4 isoforms and expression in normal tissues. The top panel depicts linear map of the full length and an alternatively spliced form of hPLCδ4 proteins. The dotted line refers to exons deleted, the triangle refers to intron inserted, and the stop signs refer to premature stop codons introduced as a result of alternative splicing. The lower panels show Northern blot (left panel) and PCR analysis (right panel) of PLCδ4 expression in various normal tissues.