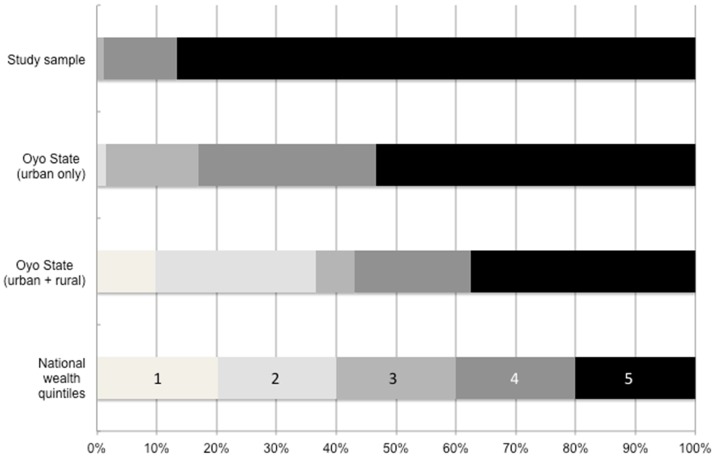
Figure 1. Wealth distribution of enrolled participants versus state and national populations.
When comparing the wealth distribution between sampled individuals to that of the state and national populations captured by the 2010 MIS, those in the wealthiest quintile are disproportionately represented in the study sample. Based on the composite asset ownership measure, no individuals in the study sample were from the lowest two wealth quintiles of nation. Although the population of Oyo State, and particularly in urban areas, is also comprised of households that are much wealthier than the nation as a whole, the study sample's wealth composition is even more concentrated among the wealthiest. Source: 2010 Nigeria Malaria Indicators Survey.

