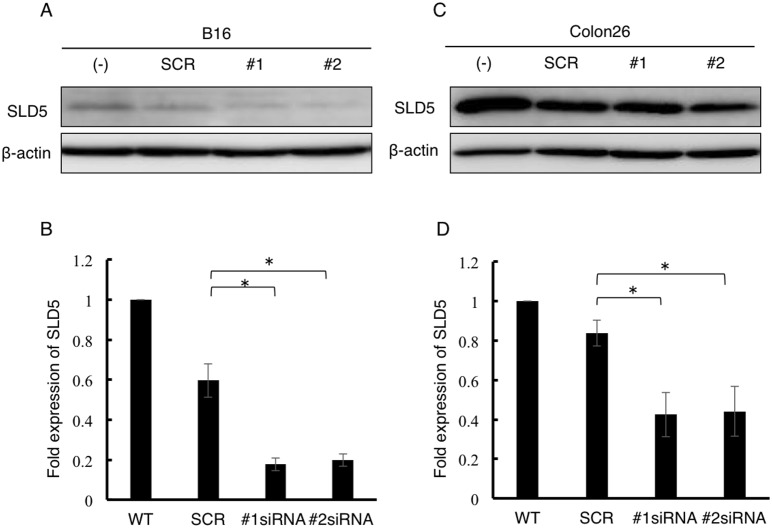
Figure 4. Silencing of SLD5 by siRNA in B16 and Colon26 cancer cells.
B16 or Colon26 cells were transfected with scrambled negative control (SCR) or SLD5 siRNAs (#1, #2) and harvested 48 h after transfection. SLD5 protein expression levels in B16 (A, B) or Colon26 (C, D) were quantified by Western blotting. β-actin was the internal control. Data were quantitatively evaluated based on densitometric analysis (B, D). Results are represented as fold-change compared with the level seen in siRNA-untreated B16 cells (B) or Colon26 cells (D), respectively. Data represent the mean ± SD.*, P<0.05 (n = 3).

