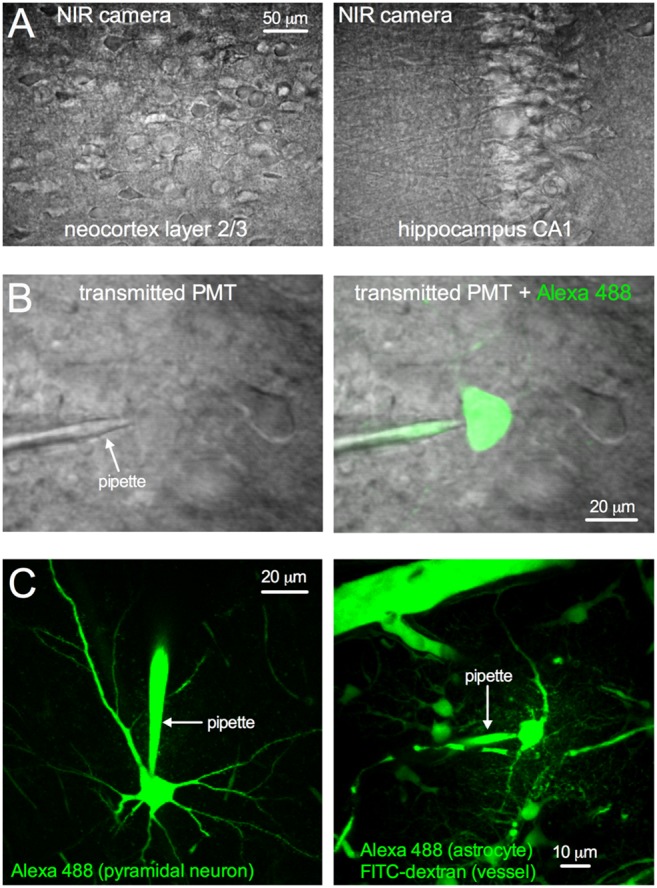
Figure 12. Microscope Performance: visually guided patch clamp.

A) NIR LED and camera transmitted image of acutely isolated brain slices of the neocortex (left) and the hippocampus (right). B) Transmitted image of the tissue generated by the Ti:Sapph beam captured on the under-stage PMT. Patch pipette and cells can be visualized (left). A successful patch is shown with Alexa 488 fill (right). C) Whole-cell patch clamp of cortical pyramidal neuron (left) and astrocyte (right), each dialyzed with a standard K-Gluconate internal solution containing 100 µM Alexa-488 (Green). Images are displayed as a max projection to capture the cell(s) and the patch pipette.
